Winners and losers as COVID-19 impacts newsagency sales across Australia.
While some retail newsagencies report 40% and more growth in revenue in April 2020 compared to April 2019, others report 60% and more decline. Such is the gap in the experience of Australian newsagency businesses in this COVID-19 impacted world.
Looking at comprehensive sales data from 139 newsagencies the results are stunning in that never before in 20 years of benchmark analysis have I seen such a gap in business performance.
The gap in performance has a fresh subtlety too. Whereas in previous studies, geography was the key factor, now, in this COVID-19 world, situation is the key. High street retailers, retailers outside of shopping centres, are faring much better.
In addition to extraordinary overall growth / decline performance, there are surprises in some product categories. Let’s get into it…
THE DATASET
This newsagency sales benchmark study represents a comparison of sales data from 139 newsagency businesses comparing sales from April 2020 with April 2019. It’s a same store year on year comparison from a broad cross-section of businesses: city, country, high street, mall, banner groups, independent. The only thing connecting the businesses is that they use the Tower newsagency software.
OVERALL PERFORMANCE METRICS.
- Transaction count. City high street: -4.5%; City mall: -45%; Regional high street: -6%; Regional mall: -35%.
- Sales revenue. City high street: +6%; City mall: -38%; Regional high street: +12%; Regional mall: -24%.
- Basket depth. City high street: +11%; City mall: +3%; Regional high street: +13%; Regional mall: +4%.
- Basket dollar value. City high street: +31%; City mall: +13%; Regional high street: +21%; Regional mall: +17%.
CORE PRODUCTS.
- Newspapers. Over the counter unit sales. City high street: +6%; City mall: -55%; Regional high street: +11%; Regional mall: -31%. NOTE: the gap in the city high street cohort is considerable, making the average somewhat meaningless. For example, one city high street business reports a decline of 17% while another in the same state reports an increase of 15%.
- Magazines. City high street: +21%; City mall: -32%; Regional high street: +23%; Regional mall: -7%. NOTE: Within magazines, crosswords, calming titles and escape type titles have done well. Even the dubious content filled weeklies have performed well.
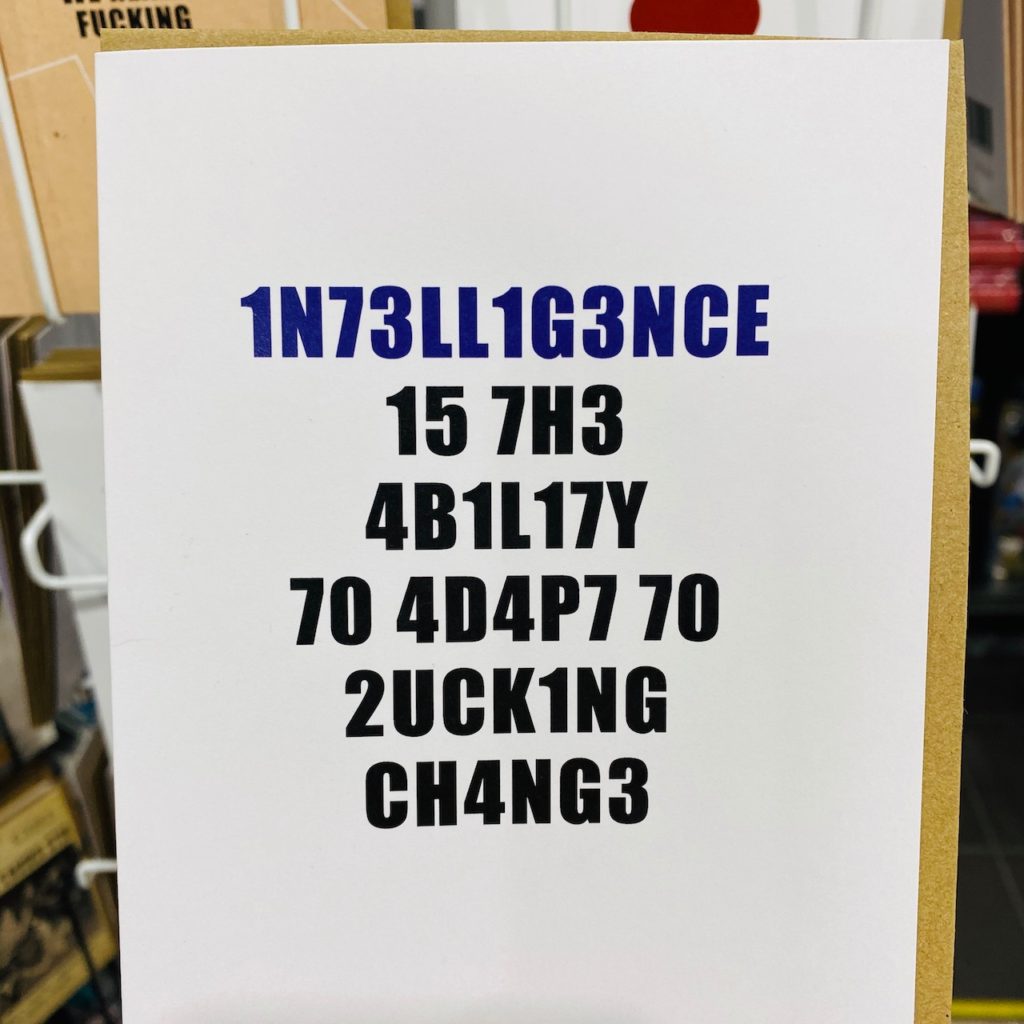
- Greeting cards. Revenue. City high street: -7%; City mall: -32%; Regional high street: -12%; Regional mall: -31%. NOTE: cards were hit hard early in March because of the tactile nature of browsing cards. There was an indication of improvement in April but it was slow.
- Stationery. Revenue. City high street: +9%; City mall: -42%; Regional high street: +13%; Regional mall: -16%. A challenge with stationery has been supply.
- Lotteries – instant scratchies. City high street: +24%; City mall: -5%; Regional high street: +37%; Regional mall: -4%.
- Lotteries. Revenue. City high street: +3%; City mall: -8%; Regional high street: +5%; Regional mall: -6%.
- Tobacco. Revenue. City high street: +11%; City mall: N/A; Regional high street: +27%; Regional mall: N/A.
KEY SPECIALTY PRODUCTS.
- Gifts. Revenue. City high street: +9%; City mall: -31%; Regional high street: +18%; Regional mall: -26%.
- Toys. Revenue. City high street: +125%; City mall: -38%; Regional high street: +145%; Regional mall: -22%. Less than half the stores in the study have toys.
Toys includes puzzles. In one city high street business jigsaw sales in April went from $870.00 in 2019 to $4,300 in 2020. They were not alone. I mention this to indicate that the average above, 125%, does not do justice to the businesses that positioned themselves well to leverage the jigsaw opportunity.
Gift results are actually all over the place too given that there is a lack of consistency in our channel for what is regarded as a gift.
GP SHIFT.
Exposed in deeper analysis of the sales data is a shift downward in overall GP performance in businesses stock in lotteries, papers and magazines. This result makes for a complex discussion with landlords who may only look at revenue, and not the underlying gross profit performance.
The scratchie surge is considered to be due to people having cash in their pockets from the early boost to Newstart and the closure of poker machine venues.
ONLINE.
Online has proven to be key through all this. Businesses with an established online platform have done well through deliveries=, click and collect and variations of these.
HEALTH OF THE NEWSAGENCY CHANNEL.
I’d say that overall, the channel is okay. Yes, just okay. While there are some stand out successes, there are more at the other end of the scale. The future depends on what happens next and what retailers do next.
There is no doubt that business has fundamentally changes. As local service-oriented retailers, the newsagency business has to change too. This is why I say what we see next in terms of success or otherwise will depend on smart tactical engagement as well as an ability to successfully predict future trends.
While predicting the future has always been a challenge for business owners, it is even more so now because of how CCOVID-19 has impacted the whole of the economy.
WHAT’S NEXT?
While I have thoughts on that, I’ll same them for another time. I would note, however, that every business that shared data with me has opportunities revealed in their data. I urge people to start there. Look at the trends your data reveal.
Finally, I am grateful to all newsagents who shared their data for inclusion in this study.
Mark Fletcher.
Email: mark@towersystems.com.au Website: www.towersystems.com.au Blog: www.newsagencyblog.com.au
M | 0418 321 338