Tabcorp and Tatts merger supported by newsagents and lottery retailers
The Australian Lottery and Newsagents Association is pleased with the Australian Competition Tribunal’s approval of the proposed combination of Tabcorp and Tatts
FOR IMMEDIATE RELEASE
Australia, 20 June 2017: The Australian Lottery and Newsagents Association (ALNA) is pleased with the Australian Competition Tribunal’s approval of the proposed merger of Tabcorp Holdings and Tatts Group.
Adam Joy, CEO of ALNA stated, “We believe that a merged business is likely to prove a synergistic and mutually beneficial commercial partner for Australia’s largest retail and home delivery group: the lottery and newsagents industry. A combined business would be better placed to bring fresh and innovative opportunities to the market and reinvigorate lottery products.
“As the national industry body representing Australian lottery and news agents, ALNA considers that the merged entity’s greater scale, resources, commitment to investment, national footprint and enhanced operational strength would help to realise and deliver considerable mutual benefits to our members and their customers.”
ALNA considers that the transaction offers our members, as key stake holders, an opportunity to partner with a merged business that we are confident will have a culture and approach that works better in partnership with news and lottery agents to support the lotteries business.
While the proposed merger brings many benefits to newsagents and lottery retailers, the current uncertainty while a final decision is pending is causing significant implications for new lottery shop fits.
Ben Kearney, ALNA National Manager, Policy and Government Relations said, “A large number of our members are in the process of new lottery shop fits, the largest investment they will undertake in many years. Until a potential merger is finalised, we would like to see shop fits put on hold until a strategy from a merged entity is in place.”
The lottery and newsagents industry, as franchisees of the Tatts Group deliver $1.3 billion in consolidated revenue to state governments through the sale of official lottery products. This money supports good causes such as schools, hospitals, police and many other essential infrastructure activities.
Mr Joy added, “The reinvigoration of lottery products requires a commercial partner that recognises and values the role of news and lottery agents, and is prepared to collaborate and invest in lottery product innovation with retailers. We consider that Tabcorp has demonstrated a track record of achieving growth and sustained product momentum. Achieving omni-channel growth in partnership with bricks-and-mortar distribution partners is beneficial for small business, the lottery operator, as well as the industry’s vital role in our nation’s economy.
There are over 5,000 independent, family-owned newsagents in Australia. The industry employs more than 20,000 people with a turnover of $6 billion and sees approximately 2.3 million people every day across Australia.
For ALNA’s members offering lottery products, these products make up a considerable part (approximately 10-25%) of their direct revenue – and in many cases of lottery-only kiosk significantly more than this. Lottery products also attract considerable foot traffic, which then provides retailers the opportunity to generate further revenue through the sale of other products offered.
Tabcorp has extensive retail experience, digital capability, an experienced management team, a partnership approach and strong financial capacity to make investments to drive the lotteries business forward.
ALNA is one of the organisations that made a submission to the Australian Competition Tribunal in support of Tabcorp’s bid to acquire the Tatts Group, and believes that the proposed merger will support the sustainability and the newsagent and lottery industry as a whole.
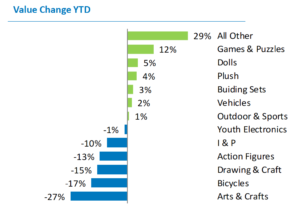 Three weeks ago I got to see the latest toy category performance data for Australia. It makes for interesting reading. I was particularly pleased with the result achieved for games and puzzles as this is a segment we embrace.