A blog on issues affecting Australia's newsagents, media and small business generally. More ...

Newsagency benchmark

The problem with ATO newsagency business benchmarks continues

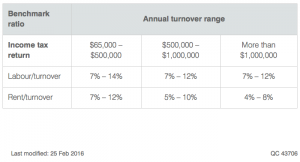
Screen Shot 2016-03-08 at 8.45.07 amAnother newsagent is being audited by the ATO as their ratios fall outside the ATO published benchmark. The problem is, the newsagent has not done anything wrong. They have not under reported income, employed people off the books or done anything to warrant the audit. Their only ‘crime’ is submitting end of financial year numbers that do not fit the ATO narrow model.

This poor business is now penalised with an expensive audit – for which the ATO will offer no compensation, even when they find the business has done nothing wrong.

It is appalling the ATO sets its benchmarks without reasonable industry consultation and triggers an audit without justification other than a comparison with their benchmarks.

An ATO audit of a business that has not done anything wrong is a further tax on the target business. For a small business using external accounting services the cost can be considerable. This is why I say the ATO ought to refund the real cost of complying with the audit request, so the ATO is financially responsible for its actions.

If they ATO had to pay for wasteful audits it might be encouraged to revisit its benchmarks and thereby trigger less unwarranted audits.

The problem with thenATO is they do not engage on any rinsable level when you try and discuss anything like this with them. They are your worst nightmare government bureaucracy. There is no consideration that they have done anything wrong and always a presumption of guilt, especially when it comes to small business.

I urge newsagents to read through the entire benchmark page and see whether you fit within the ATO expectations.

11 likes
Newsagency benchmark

Updated newsagency performance benchmarks

Further to a discussion here, I decided to publish updated newsagency performance benchmark targets, to reflect the rapidly changing nature of our channel. These are some of the benchmarks I have provided to newsXpress members, but not all.

I say rapidly changing nature of our channel because that is what we are seeing. The traffic mix is changing as is the mix of what successful newsagents sell.

The benchmarks below are guidelines. They are subject to change as the suggested business model evolves.

It is important to have a goal, a target and that is what these benchmarks represent in my view:

  1. Gross profit: this is the goal gross profit for all product sales not taking into account any revenue or costs related to any agency business. The traditional newsagency average is 28% to 32% as shown through the Newsagency benchmark Studies. I think the goal today has to be at least 45%.
  2. Ratio of Gift revenue to Card revenue: 50% minimum. The goal ought to be 100% or more. If you do $100K a year in cards, target to do $100K in gifts, or more. NOTE: Gift is gift, not toy, collectible or other items. They have their own benchmarks.
  3. Revenue per employee – $250 an hour minimum.
  4. Revenue PSQM $4,500 – $8,500 depending on country versus city / high street to shopping centre and depending of the product mix. Higher GP lower revenue required.
  5. Overall revenue mix percentage targets: Cards: 25%; Gifts/toys/plush: 25%; Stat: 10%; magazines/newspapers: 20%; other: 15%.
  6. FLOORSPACE ALLOCATION: Cards: 25%; Gifts: 25%; Stat: 8%; magazines/newspapers: 15%; other products: 15%; office/back room / counter: 12%. It’s rare you make money from an office or store room.
  7. Mark-up goals: Stationery: 125%; Gifts 110%.
  8. Occupancy cost: between 9% and 11% of revenue where revenue is product revenue plus commission from agency lines. Location and situation are a big factor in this benchmark. For example, a large shopping centre business will have a higher cost than a high street situation. NOTE: It is easy to say the landlord is responsible for this ratio. As the retailer you are responsible for margin and revenue.
  9. Labour cost: between 9% and 11% of revenue where revenue is product revenue plus commission from agency lines. Labour cost should include fair market costs for all who work in the business.

These benchmark figures don’t all need to be considered together. You can pick one, measure, work on it, measure and adjust as the numbers indicate. The goal is to continually improve to pass the benchmark and work on the next.

I acknowledge these benchmarks are not close to what newsagent associations have recommended or would recommend. My focus is on the future whereas their focus tends to be on old-school products and services. Success in the future comes from diverging dramatically from the past including past benchmarks.

If you have any questions about any benchmark, please contact me. I’d be glad to help.

20 likes
Gifts

RETAIL NEWSAGENCY SALES BENCHMARK COTOBER – DECEMBER 2015 vs 2014

The December 2015 quarter was tough for many newsagencies, especially with print media products. Here are the year on year same store comparison numbers.

  • Customer traffic. 78% of newsagents report average decline of 1.2%.
  • Overall sales. 76% reported an average revenue decline of 1.6%.
  • Basket depth. 68% report a 1.5% decrease in basket size.
  • Basket dollar value. 63% report an decrease in basket value of 1.2%.
  • 37% of respondents using a structured loyalty offer.

Benchmark results by key departments:

  1. Magazines. 81% of newsagents report an average decline in unit sales of 9.5%. The average decline in weeklies was 10.5%.
  2. Newspapers. 82% report average decline in over the counter unit sales of 7.9% . Capital and regional city dailies lead the decline.
  3. Greeting cards. 51% of report average revenue decline of 2.1%.
  4. Lotteries. 51% of those with lotteries report an average decline of 2% in unit sales.
  5. Stationery. 67% of newsagents reported a decline, with an average of 5%.
  6. Ink. 25% of stores report ink separately. Of these, 52% reported decline of 2%.
  7. Gifts. Of the 68% in the offering gifts, 60% reported growth with an average of 7%.
  8. Tobacco. Of the 45% with tobacco, 70% reported an average decline of 16%.
  9. Confectionery. 50% of stores reported an average decline of 2%.
  10. Toys. Of the 25% with toys, 65% reported growth of 5%.

While these numbers do not reflect good news for the channel, the positive side of the numbers are good for the businesses reporting them. For example, close to half newsagencies reported a decline in greeting card sales while almost the same number report growth. The difference between the two, the gulf, is considerable. Allowing for local situations, there is a point difference of eight between the average decline and the average growth. This is considerable. The businesses achieving 6% year on year growth from high margin card sales are in a different situation than those experiencing 2% year on year decline.

Look at gifts, the story is similar but even more complex. While the gam between those reporting growth and those reporting decline is considerable, more than ten points, that 32% of newsagents do not have a gift department is alarming given their greeting card sales. Even more interesting is the difference in gifts sold. Whereas in an average newsagency, gift revenue is equal to around twenty percent of card revenue, there are newsagencies where gift revenue is more than double card revenue. These are businesses aggressively pursuing change.

I saw data for one store that is a stunning turnaround. Indeed, the result was so good I made a YouTube video about it and other stores in this benchmark group: https://youtu.be/f-YilFlFG68

In my own newsagency: My key category numbers off a good base, are: Books: up 500+% due to trend chasing. Diaries: up 219%. Cards up 19%. Gifts up 60% and account for 15% of sales; Magazines down 1% and weeklies down 3%; Stationery up 5%, Plush up 18% and accounting for 9.15% of sales. Traffic: down 2%; Average Sale Value: up 9%; Average Item Value: up 11%.

2016 OUR YEAR TO EMBRACE

Success is there for the taking in any newsagency situation. I firmly believe that. In cities and country towns. In shopping malls and on the high street. We, each of us, can make our own success by embracing change and being serious about how we run our businesses – through the deliberate choices we make.

We have more control over our businesses than ever before. What we do with this is up to us. The trends affecting us are obvious. Our future is ours to own.

Please take this benchmark report as a call to action. Make 2016 the year you want.

15 likes
Management tip

RETAIL NEWSAGENCY SALES BENCHMARK JULY – SEPTEMBER 2015 vs. 2014

September quarter results reveal a mixed bag of results for newsagents. The gap in results between businesses is wider than ever and the performance of print media products more concerning than ever.

While some newsagents are generating ne traffic from new products to the traditional newsagency, not enough are doing this.

Change is essential. Too many newsagents and traditional newsagency suppliers are operating business as usual model. This is driving the downward trend I see at the core of the benchmark results for many newsagencies. The only way to arrest this is to drive change – in supplier relationships and in newsagencies.

Here are the headline numbers for the benchmark study:

  • Customer traffic. 81% of newsagents report average decline of 4.3%.
  • Overall sales. 73% reported an average revenue decline of 3.4%.
  • Basket depth. 66% report a 1.8% decrease in basket size.
  • Basket dollar value. 21% report an increase in basket value of 3.9%.
  • 36% of respondents using a structured loyalty offer.

Benchmark results by key departments:

  1. Magazines. 94.1% of newsagents report an average decline in unit sales of 7.3%. The average decline in weeklies was 8.9%.
  2. Newspapers. 81.3% report average decline in over the counter unit sales of 7.8% . Capital and regional city dailies lead the decline.
  3. Greeting cards. 54.2% of report average revenue growth of 3.1%.
  4. Lotteries. 58% of those with lotteries report an average decline of 2.7% in unit sales.
  5. Stationery. 62.8% of newsagents reported a decline, with an average of 5.4%.
  6. Ink. 27% of stores report ink separately. Of these, 55% reported decline of 2%.
  7. Gifts. Of the 63% in the offering gifts, 58% reported growth with an average of 6.2%.
  8. Tobacco. Of the 48% with tobacco, 75% reported an average decline of 14%.
  9. Confectionery. 52% of stores reported an average decline of 3.7%.
  10. Toys. Of the 27% with toys, 63% reported growth of 4.2%.

Product mix shift. The shift in product mix continues. For example, the gift and related maximum single item price point I have seen this quarter is $1,000.

Traffic shift. Whereas the newsagency channel was built in print media products, they are less likely to be the destination purchase than today. I suspect this is a consequence of deregulation, of publishers facilitating access in supermarkets, c-stores and other locations.

In my own newsagency: My key category numbers off a good base, are: Books: up 1,000+% due to adult colouring. Diaries: up 196%. Cards up 25% with Everyday Counter up 38%. Cards account for 23.78% of sales; Gifts up 35% and account for 11% of sales; Magazines up 5% and weeklies down 5%; Stationery down 8%, Plush up 28% and accounting for 8.24% of sales. Traffic: no change; Average Sale Value: up 8%; Average Item Value: up 11%.

Here is data from another newsagency embracing growth strategies: Books: up 1,000+% due to adult colouring. Diaries: up 187%. Cards up 29% with Everyday Counter up 22%; Gifts up 47% and account for 13% of sales; Magazines up 7% and weeklies up 5%; Stationery up 7%, Plush up 24% and accounting for 8.6% of sales. Traffic: down 3%; Average Sale Value: up 9%; Average Item Value: up 11%.

CONTEXT

In the benchmark pool for this quarter, there are newsagencies with gift revenue of more than $50,000 and others with gift revenue under $500.00. To look at this in another way, there are newsagencies with gift revenue equal to or greater than card revenue and others with gift revenue equal to 5% or less than card revenue. I could share similar ratio analysis for plush, toys and selected other high margin categories.

NEWSAGENTS, IT IS YOUR FUTURE TO OWN

I urge newsagents to focus on traffic in gifts, plush, toys, homewares, fashion, ink and office furniture opportunities. You have to buy well and promote even better. More often than not your suppliers will not be traditional newsagency suppliers.

We have more control over our businesses than ever before. What we do with this is up to us. The trends affecting us are obvious. Our future is ours to own.

Please take this benchmark report as a call to action.

12 likes
Newsagency benchmark

Q3 2015 newsagency benchmark study announced

I emailed newsagents this morning seeking data for the Q3 2015 newsagency sales benchmark study. You can read the results of the Q2 study here. I am excited to see trends and generally check on the health of the channel.

Q3 2015 NEWSAGENCY SALES BENCHMARK STUDY.
I am preparing a fresh benchmark study for the newsagency channel to look at the latest sales trends overall and in key product categories. This study will help newsagents see the future based on the data trends. It will also reveal the difference between emerging newsagency model changes. Click here for my last report.

How to participate.

  1. Please run a Monthly Sales Comparison Report for 01/07/2015 – 30/09/2015 compared to 01/07/2014 – 30/09/2014.
  2. Tick the category box.
  3. Tick to exclude home delivery and sub agent data.
  4. DO NOT tick the supplier box.
  5. Preview the report on the screen. Save as a PDF and email this to me at mark@towersystems.com.au.

I will email the results to all participating newsagents and publish the results on the Australian Newsagency Blog as a community service.

Tower Systems serves in excess of 1,860+ newsagents with best practice newsagency software.

8 likes
Newsagency benchmark

RETAIL NEWSAGENCY SALES BENCHMARK APRIL – JUNE 2015 vs. 2014

The June quarter was tough newsagents. Sales in the core traffic driver of magazines declined more sharply than in recent quarters. Add to this the continuing decline in newspaper sales and we ought to be very concerned as the traffic from print media sits been at the core of viability for many newsagencies.

Cards, too, experienced a tough quarter with the majority of newsagents reporting declines as did lotteries.

Traffic is mission critical for our channel. With core traffic categories of papers, magazines and lotteries declining for many, the question has to be: what new traffic initiatives are you engaging with? Sitting by and watching the traffic decline and complaining about it is no plan. What new traffic initiatives have you engaged? Your answer is critical to the future of your business.

Here are the headline numbers for the benchmark study:

  • Customer traffic. 77% of newsagents report average decline of 2.6%.
  • Overall sales. 61% reported an average revenue decline of 3.1%.
  • Basket depth. 65% report a 2.5% decrease in basket size.
  • Basket dollar value. 232% report an increase in basket value of 3.8%.
  • Discounting. 35% of respondents using a structured loyalty offer.

As has become common in the benchmark studies, the performance of the channel is not uniform. While there is bad news, there are many newsagents enjoying growth.

Benchmark results by key departments:

  1. Magazines. 92.9% of newsagents report an average decline (in units) of magazine sales of 9.1%. Weeklies lead the decline.
  2. Newspapers. 69.3% report average decline of 5.5% in unit sales. Capital city dailies lead the decline.
  3. Greeting cards. 57.9% of report an average decline of 3.9%.
  4. Lotteries. 55% report an average decline of 2% in unit sales.
  5. Stationery. 58.5% of newsagents reported an average increase of 3.5%.
  6. Ink. 29% of stores report ink separately. Of these, 62% reported growth of 4%.
  7. Gifts. Of the 83% in the offering gifts, 71% reported average growth of 6.8%.
  8. Tobacco. Of the 50% with tobacco, 75% reported an average decline of 6.8%.
  9. Confectionery. 52% of stores reported an average increase of 2.7%.
  10. Toys. Of the 32% toys, 69% reported growth of 7.2%.

Product mix shift. The shift in product mix I have seen recently continues. Ranges are expanding as is the average price point.

My own numbers off a good base, are: Books: up 586% and accounting for 2% of sales (thanks to adult colouring). Diaries: up 78%. Cards up 14% with Everyday Counter up 24%. Cards account for 25.44% of sales; Gifts up 45% and they account for 12% of sales, Magazines down 7% and down to 27% of sales from 34%, Stationery up 8%, Plush up 17% and accounting for 12.34% of total sales and Toys up 161% and now at 4% of sales. Traffic: down 2%; Average Sale Value: up 10%; Average Item Value: up 19%. Each of these key measurement points compounds on the other. Sales: up 11%. GP: up 15%.

My newsagency is in an outer suburban Westfield centre in Melbourne with around 300 stores including majors, a nextra newsagency, two Coles supermarkets, Wild, Typo, several large independent card shops and twelve gifts shops. We fight a tough battle. What we do in this business any newsagent can do. Growth is achievable.

NEWSAGENTS, IT IS YOUR FUTURE TO OWN

I urge newsagents to focus on traffic followed closely by margin (GP). Attracting new shoppers to your business is vital and guiding them to purchase items that have a higher margin (50% and more) is essential.

  • New traffic can be found in gifts, plush, toys, homewares, fashion, ink and office furniture opportunities. You have to buy well and promote even better. More often than not your suppliers will not be traditional newsagency suppliers.
  • Higher margin can be achieved if you have a consistently pitched loyalty program and carry items not readily available in other shops near yours.

We have more control over our businesses than ever before. What we do with this is up to us. The trends affecting us are obvious. As I note in the headline: our future is ours to own.

I worry that too many newsagents want to be told what to do. No one will do this, no one will tell you what to do. While they may provide options and ideas, what you do in your business is 100% up to you.

My advice to help you work out for yourself what to do is:

  1. Chase new traffic.
  2. Make your shop different to what is usual for a newsagency.
  3. Buy products for potential and not to stay within the boundaries you set for the business.
  4. Buy for your customers and not for yourself.
  5. Be a retailer first and a newsagent second.
  6. Most important: know your numbers and run your business chasing better numbers.

Please take this benchmark report as a call to action.

I’d be happy to comment confidentially on any individual situation.

17 likes
Management tip

RETAIL NEWSAGENCY SALES BENCHMARK JANUARY – MARCH 2015 vs. 2014

The January through March quarter was tough for plenty of newsagents. Key traffic categories magazines and newspapers experienced further declines. To balance this, cards and stationery did okay. New traffic areas such as gifts and plush in engages newsagencies did well.

Here are the headline numbers:

  • Customer traffic. 68% of newsagents report average decline of 1.7%.
  • Overall sales. 63% reported an average revenue decline of 2.9%.
  • Basket depth. 61% report a 2.1% decrease in basket size.
  • Basket dollar value. 21% report an increase in basket value of 2.4%.
  • Discounting. 23% of respondents using a structured loyalty offer.
  • Circulation. Newspaper and magazine sales continue to decline.

It is not possible to declare the performance of the channel as uniform. The gap between those in decline and those growing is greater than ever.

Benchmark results by key departments:

  1. Magazines. 71.4% of newsagents reported an average decline (in units) of magazine sales of 6.15%. Weeklies, food and fashion lead decline.
  2. Newspapers. 87.3% reported average decline of 4.6% in unit sales. A state by state analysis reveals a worse situation in NSW and VIC, especially for Fairfax titles.
  3. Greeting cards. 61.3% of newsagents reported average growth of 2.9%.
  4. Stationery. 57.3% of newsagents reported an average increase of 2.3%.
  5. Ink. 38% of stores report ink separately. 54% reported growth of 3%.
  6. Gifts. Of the 80% offering gifts, 83.3% reported average growth of 7.6%.
  7. Tobacco. Of the 58% with tobacco, 62% reported a decline of 4.6%.
  8. Confectionery. 66% of stores reported an average decline of 5.7%
  9. Toys. Of the 27% with toys sales, 78% reported growth of 5.2%.

The strong are getting stronger and the weak are getting weaker. There is no geographic or demographic trend to this.

Product mix shift. The shift in product mix I have seen over the last three quarters is continuing. Ranges are expanding as is the average price point. Suppliers ought to take note of this.

I have not included my newsagency in this study as my numbers are outside the average and I did not want them to skew the results. I don’t mean this to sound arrogant.

My numbers all off a good base, are: Cards up 23% with Everyday Counter up 21% and it accounting for 56.09% of all sales, Gifts up 126%, Magazines up 1.8%, Women’s Weeklies magazines (New Idea, Who, Woman’s Day, Famous etc) up 3%, Stationery up 11%, Plush up 4% and accounting for 12.48% of overall sales and Toys up 95%. This business does not have lotteries and does not sell tobacco products.

Traffic is down 2%. Average sale value – up 17%. Average items per sale – up 2%. Overall average GP – up 14%. Each of these measurement points compounds on the other, delivering a very strong result for the business.

This growth is as a result of pursuing what we stand for. This newsagency is in an outer suburban Westfield centre in Melbourne with around 300 stores including majors, a nextra newsagency, two Coles supermarkets, Wild, Typo, several large card shops and twelve gifts shops. Competition is strong.

I include my data for comparison and to show that I walk the walk with newsagents.  I put my money where my mouth is.

What we do in this business any newsagent can do. Growth is achievable.

Newsagencies are good businesses to own. It would be wrong to say that the declines reported in this study reflect badly on the future of the channel. I think the results reflect badly on some operators, newsagents not chasing change.

The best type of newsagency to own is the one where you have the most control over what you sell and where you generate traffic for several product categories where average gross profit is 50% or higher.

The most important advice I have for newsagents has not changed: Run your business today as if today is your pay day. Too many newsagents continue to run their businesses as if their pay day is when they sell. This will not happen.

This year on year same-store newsagency sales benchmark study is an analysis of basket data from 151 newsagencies: city and country, shopping centre and high street, banner groups (Newspower, Nextra, newsXpress) and independent. To be included, a newsagency must have been using the industry standard Tower Systems newsagency software for both analysis periods and be compliant with industry data standards.

9 likes
Newsagency benchmark

Newsagency of the Future workshop – Perth next Wednesday

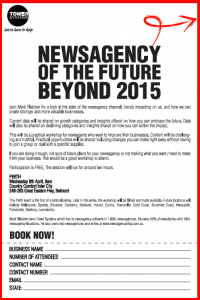
Screen Shot 2015-04-02 at 10.29.29 amI had to reschedule my last Newsagency of the Future session in Perth because of a flight delay of several hours. The next session is in Perth next Wednesday at 8am (breakfast included).

Perth. April 8. 8 am.  Country Comfort Inter City. Great Eastern Highway Perth.

All newsagents welcome. It’s free.

Click here for the booking form, or email bookings@towersystems.com.au.

I will share insights relevant to newsagents and detail opportunities available to newsagents to attract new shoppers and to improve what we make from existing shoppers. I’ll back this with data from some newsagency businesses growing against the channel average.

This Perth event is the first of a national series that will include Melbourne, Sydney, Brisbane, Canberra, Adelaide, Hobart, Cairns, Townsville, Gold Coast, Sunshine Coast, Newcastle, Parramatta, Geelong, Launceston.

2 likes
Newsagency benchmark

An Urgent Action Plan to Avoid Closure of Your Retail Newsagency

If your retail business is in tough times and facing imminent closure, you may be able to save it if you act quickly and ruthlessly. Based on years of working with many different retailers, I have found that some basic steps can successfully turnaround a business in trouble. But you need to be ruthless.

The following tips are designed for businesses with a little (but not too much) time available to fix things. While they are not appropriate to every business, the ideas can lead to others that may be appropriate.

Crucial to saving a business from closure is to understand why it is in this situation. You have to be honest with yourself about this. How did it get to this?

  • Did you not make changes to your business when you should have?
  • Has something local and unexpected impacted your business?
  • Have you been a bad retailer, allowing the business to fade away?

Do not be afraid or ignorant in confronting these questions.

Make an honest appraisal of the state of the business as the truth can inform what you do next.

You have to own your situation. This means being realistic about what you face and what got you there. This is important as it opens you to what you need to do to resolve the situation, to rehabilitate your business.

Now, to the urgent steps you could take to avoid the closure of your retail business:

  1. Know your truth. If you run a computer system, analyse the data it collects. If you don’t know how to do this, find out. Look for surprise information in your data, things you did not know about your business. For example, look at the top selling items. If there are surprises there they could inform other decisions you make to urgently address your situation. Talk to your computer software company, ask for their assessment. Knowing your truth is key to owning your situation.
  2. Quit dead stock. If you have stock on the shop floor which is old – ‘old’ can vary between product categories – and for which you have already paid, quit it. However, stock that is greater than six months old is a reasonable guide – then take action to sell this at a substantial discount. Move the stock off display units. Line it up to look like clearance stock – stacked up on tables. Setup plain and simple signs indicating the discount prices. Create signage to show it as clearance stock. If you have enough clearance stock in your business, consider signs across your front windows. Give your sale a name that is unrelated to your situation. Here are some suggestions: MEGA SALE, FIRST EVER MARCH SALE, AUTUMN SALE, SMALL BUSINESS MIGHTY BIG SALE. Give it a name you can theme around.
  3. Run a loyalty offer. Immediately setup and run a loyalty program rewarding shoppers with dollars off their next purchase. The most successful loyalty offer in recent times is discount vouchers whereby vouchers are included on receipts offering an amount which is cleverly calculated by your software based on the items in the purchase. The goal has to be encouraging shoppers to purchase again soon based on the offer on the receipt for items they just purchased.
  4. Move things around. If your business is in trouble it is likely that it has not changed much in recent years. Change it. Move departments around, shake things up so your customers trip over things they did not think you sold.
  5. Review prices. Look at the common items you sell, consider a small increase in your prices. It could be a small increase will not hurt sales volume yet will add profit to your bottom line.
  6. Upsell well. At the counter, work to extend the basket for every sale possible. Do this with clever counter product placement and witty and engaging banter with customers offering upsell products. You goal has to be to make more from each customer.
  7. Stand for something. What is different about your business? What is special about it? What makes people want to come back? If you don’t know the answer to these questions you’re in trouble. If your answer is we’re the only shop of your type nearby you’re in trouble. If the answer is people have always shopped here you’re in trouble. You need to have a difference that people want and will talk about to others. It could be a product or a service. However, it cannot be a product line that is traditional to your type of business as that will not add value to your shingle in the way you want or need. What do you stand for?
  8. Different retail options.
    1. Consider becoming an outlet shop selling items from a supplier keen to quit bulk items.
    2. Rent space in your shop to another retailer.
    3. If you have higher priced items consider offering employees commission on sales.
    4. Maybe become an outlet for local artists taking on items on a consignment basis.
  9. Stop unprofitable behaviour. If you are doing things in your business which lose money or do not contribute to a good future for the business, stop doing them. Regardless of history or what your business might stand for, continuing with unprofitable activity only makes your situation worse. If you know something to be unprofitable and yet you say you can’t stop it, think carefully about that, about why you can’t stop losing money.
  10. Get suppliers to help. Suppliers often have old stock themselves which they want to quit at a substantial discount. Buy items you have not stocked before, negotiate good prices and put the stock out with a healthy margin but still at a discount to what others would be charging. Negotiate to pay once you are paid by customers.
  11. Trim employee costs. Cut employee hours and work more in the business yourself if you are not doing so already. While this can have a significant personal cost, the less you pay others the more be business benefits in financial terms.
  12. Trim overheads. Cut everything you can: cleaning, power usage, insurance, freight, banking. Look at every supplier relationship you have and see if you can negotiate a better deal to cut your operating costs. However, do not turn off lights as darkness is death in most retail businesses.
  13. What assets can you sell? Do you have computers, retail fixtures, vehicles or other assets you no longer use in the running of the business? If they are not being used, turn them to cash as quickly as possible.
  14. Get a job. If you have a partner in the business with you and the business can run with one partner, one of you should get a job outside the business. This is especially helpful in a husband and wife situation where the family income can benefit.
  15. Talk to your landlord. A good landlord will prefer a good business to stay rather than have then close down and a new tenant having to be found. Talk to the landlord, be honest with them about your situation. Given the landlord all of the information they need to make the decision you need them to make. This information will include sales figures, expenses and margin information. Usually, the more transparent you are with the landlord the more they will support your business.
  16. Talk to your bank. While banks tend to not get involved in lending to businesses that are struggling, it may be that they have contacts that can help you navigate to a solution. Maybe talk to another bank.
  17. Talk to colleagues. If you have nearby business colleagues in the same line of business, they might have stock they are happy to provide you for free or at a discount to give you stock to move for a good price.
  18. Refresh the business. Make the business look, smell and sound fresh. Beyond the products you sell and where tings are located, change the environment itself using scents and sounds. Too often when a business is struggling, those involved let standards slip and the business does not look attractive to shoppers. Avoid this laziness at all costs.
  19. Deliver amazing customer service. When serving customers be the perfect shop assistance and not the owner of the business facing closure. Keep your mind on the job at hand and not the cliff you’re worried might be a few steps ahead.
  20. Whoever is pressuring you the most to close or contemplate closing, talk to them. If it’s a supplier, the tax office or some other organisation or individual pressuring you about debts, be upfront with them, lay out for them your plan detailing the action you will take to turn your situation around, be clear about what you are doing and outline a timeline step by step for them. Seek their support.
  21. Set a timeframe. Decide where you want to be in a week, four weeks, eight weeks, twelve weeks. Set realistic goals. Measure yourself against those goals. Know what you will do if you fall short.

What I am suggesting here is general advice. It is intended to get you thinking of ideas that could work for you.

No situation is impossible. No business is dead until the doors are closed for the last time.

Never give up. Fight hard and fight smart to turn your business around.

Facing tough circumstances in retail can be like the deer in the middle of the road facing an oncoming vehicle. Don’t freeze. Take action to mitigate your situation. A series of small steps could be the difference between closure and trading out of the problem.

I have prepared this in response to a comment from a colleague newsagent who asked for advice on how to deal with a business facing closure.

40 likes
Management tip

Tough December quarter for newsagents in the latest newsagency sales benchmark study

Australian small business Newsagents had a tough December quarter according to the latest newsagency sales benchmark study. Key performance indicators show traffic and revenue are down for many businesses in the channel.

Long-term core traffic drivers of magazines, newspapers and tobacco are challenges for newsagents. They can be lifted but it takes newsagents breaking free from the past.

Newer categories of gifts, toys and ink are growing for many.

The good news is the continuing trend – some newsagencies are growing faster than many retail businesses.

Here are the headline numbers:

  • Customer traffic. 65% of newsagents recorded an average traffic decline of 2.9%.
  • Overall newsagency sales decline. 67% reported an average revenue decline of 4.6%.
  • Basket depth. 52% reported a decrease in basket size (items in the basket) of 2.6%.
  • Basket dollar value. 18% of newsagents an average increase in basket value of 3.1%.
  • Discounting. Is increasing with 21% of respondents using a structured loyalty offer.
  • Circulation product sales. Newspaper and magazine sales continue to decline.

Now more than ever, newsagency businesses are not all the same. The gap between those in decline and those growing is greater than ever. Newsagents make choices every day that can help a business grow or hold it back.

It would be wrong to make a common statement about how they (we) are doing as there is no common situation.

Benchmark results by key departments:

  1. Magazines. 80.4% of newsagents reported an average decline (in units) of magazine sales of 6.75%. 19.6% reported average growth of 3.2%. The weeklies lead decline.
  2. Newspapers. 83.6% reported average decline of 3.4% in unit sales.
  3. Greeting cards.6% of newsagents reported average growth of 3.8%.
  4. Stationery. 72.3% of newsagents reported an average decline of 4.3%.
  5. Ink. 41% of stores report ink separately. Of these, 51% reported growth of 2%.
  6. Gifts. Surprisingly, 12.2% of newsagencies do not sell gifts. Of those with gifts, 86.2% reported average growth of 9.8% and 13.8% reported an average 6.3%.
  7. Tobacco. 38% of newsagencies in the study group do not sell tobacco products. This is a decline of 30% over a year ago. Of those with tobacco, 72% reported an average decline of 4.3% while 28% reported an average increase in sales of 3.6%.
  8. Confectionery. 62% of stores reported an average decline of 3.5%.
  9. Toys. 32% of stores reported toys separately. Of these 72% reported growth of 4.7%.

The strong are getting stronger and the weak are getting weaker. There is no geographic or demographic trend to this.

Product mix shift. The shift in product mix I have seen over the last two quarters is continuing. Within the expanding gift categories I can see some newsagents selling more expensive gifts. It is fascinating seeing these changes taking place.

I have not included my newsagency in this study. Here’s why: My numbers are outside the average and I did not want them to skew the results. I don’t mean this to sound arrogant.

My numbers all off a good base, are: Cards up 16% with Everyday Counter up 21% and it accounting for 32.02% of all sales, Diaries up 83%, Gifts up 69%, Magazines up 2%, Women’s Weeklies magazines (New Idea, Who, Woman’s Day, Famous etc) up 9%, Plush up 6% and accounting for 8.2% of overall sales and Toys up 42%. This business does not have lotteries and does not sell tobacco products.

Traffic is up 6%. Average sale value – up 8%. Average items per sale – up 3%. Overall average GP – up 14%. Each of these measurement points compounds on the other, delivering a very strong result for the business.

This growth is as a result of careful planning and pursuing what we stand for. This newsagency is in an outer suburban Westfield centre in Melbourne with around 300 stores including majors, another newsagency, two Coles supermarkets, Wild, Typo, several large independent card shops and twelve gifts shops. Competition is strong.

I include my own data here for comparison and to illustrate that I walk the walk with newsagents. When I encourage newsagents to try things it is because I do so my own business. I put my money where my mouth is.

What we do in this business any newsagent can do. Growth is achievable.

Newsagencies are good businesses to own. It would be wrong to say that the declines reported in this study reflect badly on the future of the channel. I think the results reflect badly on some operators, newsagents not chasing change.

The best type of newsagency to own is the one where you have the most control over what you sell and where you generate traffic for several product categories where average gross profit is 50% or higher.

The most important advice I have for newsagents has not changed: Run your business today as if today is your pay day. Too many newsagents continue to run their businesses as if their pay day is when they sell – this will not happen.

This year on year same-store newsagency sales benchmark study is an analysis of basket data from 167 newsagencies: city and country, shopping centre and high street, banner groups (Newspower, Nextra, newsXpress) and independent. To be included, a newsagency must have been using the industry standard Tower Systems newsagency software for both analysis periods and be compliant with industry data standards. NOTE: I have done these benchmark studies for many years, drawing on my experience with the Tower newsagent community. Around 63% of newsagents with a computer system use Tower. I have eliminated data from businesses where I knew that unique local factors impacted on the sales data.
15 likes
Newsagency benchmark

Newsagents keen to participate in newsagency sales benchmark study

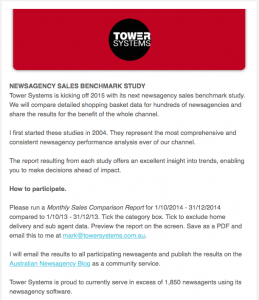
Screen Shot 2015-01-02 at 3.54.34 pmIn the 24 hours since announcing the December 2014 quarter Newsagency Sales Benchmark Study I have received more than fifty submissions.

I can tell already this will be a fascinating study with excellent insights into newsagency business performance across the country.

For years the Newsagency Sales Benchmark Study tracked declines, particularly in print media sales. Now, it is exciting to see growth in categories as more newsagents pursue change in their model and seek out new (to them) revenue opportunities.

I hope to have the analysis of the data done in the next two weeks.

While done under the auspices of my newsagency software company, the study results are made available to all newsagents through this blog.

8 likes
Newsagency benchmark

Newsagency sales benchmark study results for January through March 2014 vs. 2013

Here are the results of my analysis of sales data from more than 140 newsagencies for January through March 2014 and the same period in 2013. While there is mixed news, the news is good for newsagents who work their businesses as engaged retailers.

Customer traffic. 61% of newsagents recorded an average decline of 2.3% in transactions. 17% reported no change and the rest an average growth of 3.2%.

Overall newsagency sales decline. 52% reported an average revenue decline of 4%. Of those reporting growth, the average was 5.8%.

Basket depth. 55% reported a decrease in basket size (items in the basket) with an average decrease was 2.3%. 4% showed no change. The rest achieved 1.7% growth.

Basket dollar value. 38% of newsagents an average increase in basket value of 2.2%.

Discounting. 11% of respondents engaged in discount based loyalty marketing.

The gap between growing and contracting newsagencies must be of concern to those dealing with newsagents nationally as it is more obvious than ever. Newsagencies are not once size fits all. There are some doing very well and others doing poorly.
It would be wrong to talk about newsagents and make a common statement about how they (we) are doing as there is no common situation.

Benchmark results by key departments:

1. Magazines. 67% of newsagents reported an average decline (in units) of magazine sales of 6.9%. 5% reported no change and 28% reported year on year magazine sales growth. The average growth was 4%. This is the headline: NEWSAGENTS CAN GROW MAGAZINE SALES.

Looking at the 28% reporting magazine sales growth, most growth was outside the weeklies with less than half of those growing this all-important category.

Partworks played a big role in the growth achieved by those achieving growth. In some cases, partworks accounted for close to 20% of all magazine sales.

2. Newspapers. 86% of newsagents reported an average decline of 5.8% in over the counter newspaper sales. HOWEVER: for most, revenue from newspapers was up! This is a reflection of significant cover price rises.

3. Greeting cards. 63% of newsagents reported average growth of 2.6%. Of those reporting a decline, the average was 4.7%. Everyday counter cards dominate card sales with this category accounting for between 50% and 60% of all cards sold in most newsagencies.

4. Stationery. 65% of newsagents reported an average decline of 3.1%. Of those reporting growth, the average was 5.8%. Notice the gap there?

5. Ink. 41% of stores report ink separately. Of these, 58% reported growth of 3%.

6. Gifts. 74% of the newsagents have a separate gift department. Of these, 78% reported average growth of 8%. In eight newsagencies, gift revenue exceeded card revenue.

7. Plush. 8% of newsagencies report on plush sales separately. I recommend this. A reasonable sales benchmark for plush is revenue equal to 25% of card revenue. In stores reporting on plush, sales are up on average 30%.

8. Tobacco. 82% of stores with tobacco reported an average decline of 13%.

9. Confectionery. 53% of stores reported an average decline of 7%.

10. Toys. 53% of stores with the department reporting growth of 6%.

The strong are getting stronger and the weak are getting weaker.

There is no geographic or demographic barrier to growth from what I can see. One newsagency in a town with tough economic challenges and competing with several newsagencies achieved excellent year on year growth – by owning their situation and being proactive.

Product mix shift. Embedded in the data I receive is information about unit sale and revenues contribution between all product categories. I can see a shift from the traditional print, lottery, card and stationery mix to a broader appeal by some. It is fascinating seeing the results of deliberate actions on the shop floor to attract more shoppers to a business.

In one business, looking back over some years, gifts have grown from accounting for 1% of revenue to accounting for 11% of revenue in three years. This achievement on the back of overall revenue growth reflects a significant shift in focus in this business.

Looking at my own newsagency for this quarter: calendars are up 61% off a good base, gifts are up 93% off a good base, card sales are up 11% with everyday counter cards up 17% – off an good base, magazine sales are up 11 off a good base, weekly magazines are up 4% and they account for 24.8% of total magazine sales, plush is up 44% off an extraordinary base – we did over $21,000 in plush in the quarter.

I mention that the numbers are off a good base to provide context. The growth I claim off a low base would not be as good as these results off a good base.

Number of sales, number of items per sale and average sale value all increased. Individually that is good. Compounded, as happens, it is excellent. The benefit to the bottom line of such compounding small steps is wonderful.

I include my own data here for comparison and to illustrate that I walk the walk with newsagents. When I encourage newsagents to try things it is because I do in my own business. I put my money where my mouth is.

This newsagency is in an outer suburban Westfield centre in Melbourne with around 300 stores including majors, another newsagents twelve gifts shops – plenty of nearby and price competitors for cards, gifts, magazines and plush.

I am happy to show my data to anyone who asks. I’m also happy to explain why my numbers are so strong. My phone number is 0418 321 338 and my email is mark@towersystems.com.au.

Newsagencies are good businesses to own. This study supports this belief. That many newsagents are reporting growth is magazines sales is a testament to the active engagement of those newsagents and their employees in this traffic-critical category.

The best type of newsagency to own is the one where you have the most control over what you sell and where you generate traffic for several product categories where average gross profit is 50% or higher.

The most important advice I have for newsagents has not changed: Run your business today as if today is your pay day. Too many newsagents continue to run their businesses as if their pay day is when they sell. This will not happen.

Newsagents: look at your business, your sources of traffic, your average GP. Your success will come from many small steps.

Suppliers: Get smart in your engagement with newsagents. Trust them. Treat them with respect. Share their mission to grow traffic and GP and basket value. Give newsagents complete control over what they sell of your products.

This year on year same store newsagency sales benchmark study is an analysis of sales basket data from 147 newsagencies – city and country, shopping centre and high street, banner groups (various) and independent. To be included, the businesses must have been using the same software for both analysis periods and to be compliant with industry software standards. I have done these benchmark studies for many years, drawing on my experience with the Tower Systems newsagent community. As the owner of Tower I have easier access to the data – not automatically and not without permission from newsagents. Around 63% of newsagents with a computer system use Tower. I have eliminated data from businesses where I knew that unique local factors impacted on the sales data.
11 likes
Newsagency benchmark

Newsagency business sales analysis – better data helps feed better business decisions

I took a look at Jan. – Mar. 2014 vs. 2013 data for a newsagency from a major suburban shopping centre this week and here are comments I shares with the owner:

Being in such a major shopping centre with so many competitors for what you sell can be a challenge.

I don’t know how you manage the business with so many categories of products in departments. Take cards, they account for 17.05% of your revenue and you have more than 120 categories of products listed in your card department – many delivering sales of 1% or less.

Once I break this out I can see the various major suppliers and do wonder whether spreading your card offer across so many suppliers offers the best shopper experience. I understand the desire for variety. However, this needs to be balanced against management time cost and the overall shopper experience. Focussing on a major supplier allows you to leverage them more in telling / selling your card story.

Your card revenue is down 3% year on year.  This is in a quarter when the majority of newsagents are reporting growth. In fact, there is a gap of nine percentage points between your business and the average newsagency.

Your gift sales are considerably below average. Based on your card sales, your gift revenue this quarter ought to be in excess of $20,000. With 16.38% of your gifts uncategorised it is challenging to be detailed on the opportunities.

Magazine unit sales are up 10% year on year in a terrific result. Your growth in weeklies of 5% is excellent.  Not so good is that 22.8% of your magazine sales are uncategorised. Your data management is not up to standard.

Your stationery revenue is down 7% which wile not ideal, is not dreadful. What is dreadful is your data management.  You have categories that may mean something to you but are non standard – making it hard for you to eventually sell the business with good data management.I have never seen categories like you use and while they may help you, they make like for like comparison challenging.

Your book results are excellent and against trend. That this department generates 1.58% of your revenue is terrific. The year on year growth of 4% is great.  It see an opportunity for you in gifts and calendars based on your book sales. For example, food titles account for 11% of your book sales and these can play out in calendar and gift sales.

You have a large and successful business but I am left wondering if it could be more successful with better data management.

I hope this helps.

In response to a question I had yesterday, I don’t disclose the identity of the newsagency as it serves no purpose. All of us have challenges in our businesses and things we miss in the day to day running of our businesses.

I post this information here so newsagents can read it and see things that relate to how they run their business as well as to see opportunities based on good things newsagents are doing.

7 likes
Newsagency

Newsagency performance analysis highlights the value of pursuing change

Here’s a report I did for a newsagent recently assessing the performance of their rural business. This is an interesting newsagency business because of the transition path they are walking their business through and the wins they are achieving as a result.  here is what I wrote to them:

Overall, the figures are good despite their being a revenue decline as you are transitioning the business to a higher margin offering as evidenced by your excellent growth in gifts.  It’s important you see these results as the next step with more steps to go.
Your overall traffic is down 7% yet your revenue is down 5%. This reflects an 11% increase in items per sale. The key to growth in profitability for a newsagency today is growth across a range of measurement points: traffic, items in the basket. GP per sale, operating cost per $ earned and labour cost per $ earned.
Based on the data in your reports there are several ideas I’d work on if I were you:
  1. Weekly magazines. These account for 42.55% of all magazines you sell and they are down 9% year on year – not far off your overall traffic decline. I can see you started discount vouchers recently. I expect that this will help lift weekly magazine sales. The program usually takes three months to settle in. That said, you need to look for more that you can do to drive weekly magazine sales: make sure they are located in a couple of locations, engage in a front of store promotion, use your other marketing tools to pitch the category.
  2. Other magazines. Look at what you can do to drive these so that you are not as reliant on weeklies. For example, are your men’s titles well located and well promoted. Do men have their own area? they like that.
  3. Lotto. Your growth is excellent. Are you doing anything to leverage lotto traffic for other product categories to drive efficiency from the lotto shopper? What do they see on the way in and on the way out? What do they see at the counter?
  4. Gifts. You’ve gone from selling 92 last year to 412 this year. Stick to your patch, keep expanding based on what is working. But use small steps to stay within budget.
  5. Ink. Your entry into this category is an excellent start-up success. 106 cartridges in your first three months shows you can expect to have sales of $15,000 a year or more from this category. Take care with buying – to stay within the brands that are working for you.
  6. Drinks and confectionery. Your sales growth is excellent and this makes me wonder about a margin opportunity. Could you increase your prices of selected popular items slightly to make the convenience of your offering more valuable to you?
  7. Stationery. This appears to be a transitioning department for you with a significant sales fall. Or, are your eyes off the ball?  Take a look at the numbers and see what you can do to lift. Location? Range?
  8. Plush. Wow. A new product category and you;re doing over $100 a week. As a ratio of plush to cards – you’re in good shape. I suspect you have plenty more growth ahead.
  9. Cards. Your data suggests more work is needed to settle the recent changes in. Is the range ideal? Do you have good price points? Are your staff well trained in selling cards?  Have you considered promoting cards off-location – i.e. to your excellent lotto and magazines traffic?
You should be proud of how 2014 has started for you. I think you have an excellent rest of the year ahead for you.
7 likes
Newsagency benchmark

Statement from Matt Handbury in relation to Hubbed

Matt Handbury contacted me over the weekend and provided this statement in relation to Hubbed:

Hubbed: Setting the record straight

In response to speculation about the operational performance and governance arrangements at Hubbed, I feel it is in the best interests of the newsagent community
to provide some much needed clarity around these issues.

First, I can confirm that I have resigned as a director of Hubbed, and that my substantial investment as a shareholder is yet be repaid.

Given that legal proceedings are pending, I do not wish to comment further on this issue, other than to say I no longer have confidence in the management of the company. My involvement with the board and management of Hubbed has come to an end.

My experience with Hubbed has deepened my conviction that harnessing the power of e-commerce will provide significant and sustainable new revenue streams for newsagents. It can also greatly enhance newsagents’ services to customers and the publishers and e-retailers they serve. I am determined to bring this to reality and you will be hearing from me in the coming weeks.

All newsagents, both those already dealing with Hubbed and those considering how to embrace e-commerce in their business, can rest assured that their interests will be served and their expectations and ambitions more than met.

Matt Handbury
Executive Chairman
Murdoch Media Pty Ltd

I am publishing this statement with Matt’s permission.

The ANF and other newsagent associations have been provided this statement.

I originally published this post yesterday, March 16. I reset it this morning as the content is important and blog traffic on a Monday is 1,300+ visitors whereas on a Sunday it is usually between 650 and 800.

17 likes
Hubbed

Encouraging a newsagent to break free from the past

Here are some notes I put together for a newsagency business I assessed as part of the October / December 2013 vs. 2012 newsagency sales benchmark study I did last month. These notes are for a smaller town newsagency currently offering a very traditional mix of products. Here’s some of what I found:

Your newsagency appears to be a traditional newsagency business with a focus on lotteries (57% of sales), magazines & papers (30% of sales) and a bit of cards and stationery.

This mix of products does not give you a bright future in that for the vast majority of your business you are relying on others to drive traffic. If lotteries, newspapers and magazines decline or those customers defect to other retailers you will be in a difficult situation.

A way to address this is to focus more on products and services over which you have control and through which you can advocate a point of difference.

What your point of difference? What do you think it is? It’s essential you have one – beyond being a newsagency. In your data I cannot see a point of differenced reflected. While your sales decline of 3% is less than the average for declining newsagencies, it is not a good story.

Based on your care sales I suspect you could increase gift sales by 300% or more. Plus I think you could sell more in toys and plush – I’d suspect at least $1,500 in each in the October – December quarter.

Tough as it is in a town your size (pop. circa 3,000) I’d look carefully at the businesses nearby, if you have anyone selling gifts, what are they selling? I ask because I know newsagencies in towns this size that have lifted gift sales to match card sales. If you could do that you’d see your GP for the year increase by between $10,000 and $15,000. This, in turn, would make your business more valuable.

I think mission critical to your business right now is getting known for something other than magazines, newspapers and lotteries. You need another valuable point of difference. Something that could attract people from nearby towns to your business to shop.

If I were you these are the issues I’d be considering to make the business more successful and more valuable.

We have to break free from the past and from the agent mentality. Our future is as retailers.

6 likes
Newsagency benchmark

Newsagents increase magazine sales in December quarter

The October – December 2013 newsagency sales benchmark study is the first in years to report more newsagents achieving growth in magazine sales than declining. This is great news. Digging deeper into the data I think the growth is in part due to engagement with magazines and in part due to these businesses attracting shoppers for a strong gift or card or plus (or a mix of all) offering.

Whereas in the past newsagencies have attracted shoppers for magazines, newspapers, lotteries and cards, newsagencies today that attract shoppers for gifts, plush and cards first are more likely to achieve a deeper and more valuable basket and this different shopper engagement flows on especially to magazines.

In this newsagency sales benchmark study more than any in recent years I can see more newsagents changing their businesses, pursuing new opportunities and achieving measurable results.

Here are the results of the benchmark study:

Customer traffic. 59% of newsagents recorded an average decline of 2.9% in transactions.  11% reported no change and the rest an average growth of 3.8%.

Overall newsagency sales decline.  61% reported an average revenue decline of 8%. Of those reporting growth, the average was 7.2%.

Basket depth. 54% reported a decrease in basket size (items in the basket) with an average decrease was 1.9%. 8% showed no change. The rest achieved 2.3% growth.

Basket value. 32% of newsagents reported an average increase in basket value of 2.6%.

Discounting. 14% of respondents engaged in significant discounting.

The gap between growing and contracting newsagencies is bigger than ever. This presents an extraordinary problem for the channel as growth and decline separate newsagents and their businesses from each other.

Benchmark results by key departments:

  1. Magazines.  41% of newsagents reported an average decline (in units) of magazine sales of 8.2%. 7% reported no change and 52% reported year on year magazine sales growth.  The average growth was 6%.  This is the headline –NEWSAGENTS GROW MAGAZINE SALES.The newsagents achieving growth saw this in Women’s Weeklies, Children’s, Home & Lifestyle and partworks. It’s a thrill to finally be able to report more newsagents from the benchmark pool growing magazine sales than declining.
  2. Newspapers.  87% of newsagents reported an average decline of 4.9% in over the counter newspaper sales.  More regional newspapers saw declines than usual.
  3. Greeting cards.
  4. 57% of newsagents reported average growth of 3.9%. Of those reporting a decline, the average was 5.3% – in line with a growing gap between growth and decline. Everyday counter cards were strong through this quarter with some newsagencies reporting double-digit growth.

  5. Stationery.  63% of newsagents reported an average decline of 2.4%. This continues a trend in newsagencies in relation to stationery.
  6. Ink.  46% of stores report ink separately. Of these, 65% reported growth of 7%.
  7. Gifts.  71% of the newsagents have a separate gift department. Of these, 89% reported average growth of 10%.  In ten stores, gift revenue exceeded card revenue.
  8. Plush. 9% of newsagencies report on plush sales separately.  I recommend this.  A reasonable sales benchmark for plush is revenue equal to 25% of card revenue. In stores reporting on plush, sales are up on average 25%.
  9. Tobacco. 86% of stores with tobacco reported an average decline of 11%.
  10. Confectionery. 58% of stores reported an average decline of 14%.
  11. Toys. 45% of stores with the department reporting growth of just 12%.

It is clear from the data in this study that successful newsagencies are changing more rapidly than the not so successful newsagencies and that the changes themselves are significant. It is a thrill to see newsagents chasing more traffic, better overall GP and deeper baskets.

Newsagencies continue to be good businesses to own. They respond to attention.  More than any benchmark study in the last three years, this study supports this belief. That so many newsagents are reporting growth is magazines sales is a testament to the active engagement of those newsagents and their employees in this traffic-critical category.

The best type of newsagency to own is the one where you have the most control over what you sell and where you generate traffic for several product categories where average gross profit is 50% or higher.

The most important advice I have for newsagents is: Run your business today as if today is your pay day. Too many newsagents continue to run their businesses as if their pay day is when they sell. This will not happen.

Newsagents: look at your business, your sources of traffic, your average GP. Your success will come from many small steps.

Suppliers: Get smart in your engagement with newsagents. Trust them. Treat them with respect. Share their mission to grow traffic and GP and basket value. Give newsagents complete control over what they sell of your products.

14 likes
magazines

October – December newsagency sales benchmark study under way

I am currently gathering sales data for the October – December 2013 vs 2012 newsagency sales benchmark study. I already have data for more than fifty newsagencies in a range of situations and trading under different brands.  My goal is to have the analysis completed later next week – to provide a good early assessment of the busiest quarter of the retail year for newsagents.

0 likes
Newsagency benchmark

Newsagency business performance analysis: tourist area

Here’s a newsagency business performance analysis I recently completed for a business in a tourist location:

Your business is in a unique situation being located on a major tourist area. Your situation demands you carry a broader range of products that the traditional newsagency with some of these products being very seasonal in nature.

Looking at your data it makes me wonder if you stock some products to sell out within the season, so you are not burdened with those highly seasonal products until the next season. This is certainly the approach I would take – even quitting at cost or below anything I;d have to put in storage until the next season. Otherwise you’re bound to find yourself holding stock for months on end.

Stock not on the shop floor has a high cost to the business.

In comparing sales July 1 through September 30 2013 with the same period in 2012 what stands out the most is what I cannot see. You are not managing your data well. Too much product is sold without a category. take Arts & Crafts. Your sales are $5,713 in the 2013 quarter but 99.76% of this is in unknown category. This poor data management hides a management opportunity for you.

Tracking inventory at the category level takes a bit of work to setup but once done you are better served. The quality of your business decisions, your buying especially, will improve considerably and this will help you make more money.

I’m not going to comment on all departments. Rather, I have notes about what really stands out.

  1. Coke. our sales are down 34% year on year. needs work since Coke is a beacon brand.
  2. Fax & Copy. You’re clearly offering a valuable service. Revenue is up 191%. Well done. Chase more growth. Promote this well and at every opportunity. Also look at your prices. Do they reflect the convenience of the service you offer?
  3. Gifts. Almost no sales. Based on your card sales you ought to have been able to do more than $4,000 in gift sales in this quarter. Get on it.
  4. Lottery. Up 8%. Well done. Whatever you are doing, keep it up. Also look at up-sell opportunities. What do people see as they approach and leave the lottery counter? What else is offered at the lottery counter? It looks like the majority of lottery customers make their purchase and then leave. Consider offering a coupon for a purchase that day only. Date the coupon. Make the offer compelling. make your good lottery traffic count for more!
  5. Magazines. I can see from the categories of titles you sell that yours is a genuinely mixed business in terms of gender and age. I trust your magazine department is zoned guys and girls and that your relay is fresh – a magazine relay takes between four and six hours to do. Your overall magazine sales are down 26%. This is dreadful compared to the channel average – indicating you need to put some serious work into your offer. If I were you this is where I would start in re-energising your business. Create a fresh look for magazines, chase more sales. What you are doing right now is failing.
  6. Stationery. This is up 7% and that’s god.Because of poor data management I can’t see where the growth is coming from. Whatever has changed between this year and last – do more of it.

Here are my top three things you need to do immediately and once they are done we can work on next steps:

  1. Do a magazine relay.
  2. Fix your data – assign categories to everything you sell. This is pretty straightforward to do.
  3. Leverage your lottery traffic with an offer.

Oh, and look at how you handle seasonal product.make sure you don’t hang on to anything.

I hope this helps. You should aspire to act on the three items above in the next two weeks.

5 likes
Newsagency benchmark

Newsagency business performance analysis: new owners

Here’s a brief analysis I did recently for a business under the control of new owners:

Thanks for providing your July – September 2013 versus 2012 Sales Comparison Report. In addition to considering this for the benchmark study I have looked at your data separately.

As new owners you have an opportunity to refresh the business, to put your own stamp on the business without being handcuffed to history. Here is what I can see in the data in terms of headline change opportunities.

Cards. Cards account for 5.96% of your total sales. revenue is down 13% year on year. I suggest you meet with your major card suppliers to review performance and to develop a plan for pursuing growth. I do wonder whether you have too many card suppliers to the business and whether this dilutes your caption coverage.

Gifts. Sales are down 13% off of $45,751 between July and September 2012. While this is against trend in the newsagency channel, the business you have just taken over has been strong in gifts for many years. So, the challenge is to reinstate growth. This is hard work but can be achieved by by careful management of the entire category.

Magazines. While your year on year decline of 10% in unit sales is not too far from the channel average, the 17% decline in weeklies is most concerning given this accounts for 18.32% of your sales. I suspect this is related to your 10% decline in sales (traffic). You need to act to arrest your magazine decline since magazines account for 10.27% of your sales and generate good traffic for the business. I’d suggest a relay and a fresh approach to magazines.
Stationery. The 16% decline in revenue demands attention as it’s a decline outside of the overall traffic decline.

I could comment on more departments but I don’t see value in that since you’re still settling into the business. If you’ve not done so already, I think you need to think about the business and undertake some planning. Where do you want to take it in the next year, two years? It may be that you need to undo some of what is in place today before you pursue your own goals for the business.

The data suggests that you need to pursue change, maybe cutting back on some traditional lines and pursuing more new lines. You certainly don’t want the current trend of decline across the board to continue. If it were my business I would be driven by traffic and margin. I’d focus attention of any traffic generating product category while at the same time working on margin products – products delivering north of 50% gross profit.

In thinking about change, I’d also consider what the business stands for. Right now the business is broadly based. The data does not reflect specialisation. I’d pay more attention to this and develop a strong specialisation in several areas to strengthen your traffic pull.

I hope the comments are helpful. I’d be happy to discuss them at any time in-store.

3 likes
Newsagency benchmark

Newsagency sales benchmark study results for July – September 2013 compared to 2012

This newsagency sales benchmark study is an analysis of sales basket data from 136 newsagencies – city and country, shopping centre and high street, banner groups (various) and independent.  To be included, the businesses must have been using the same software for both analysis periods and to be compliant with industry software standards.

To be clear, this is a same store year on year comparison.

Customer traffic. 52% of newsagents recorded an average decline of 3.7% in transactions.  12% reported no change and the rest an average growth of 1.8%.

Overall newsagency sales decline.  63% reported an average revenue decline of 3.6%. Of those reporting growth, the average was 7%.

Basket depth. 48% reported a decrease in basket size (items in the basket) with an average decrease was 1.7%. 26% showed no change. The rest achieved 1.8% growth.

Basket value. 46% of newsagents reported an increase in basket value – with an average of 2.3%.

Product mix. Newspapers and magazines suffered the most, again.

Discounting. The decline in discounting identified in the last three quarters has continued with only 21% of respondents discounting of any significance.

The gap between growing and contracting newsagencies is getting wider. Those growing have a more diverse product offering. The comparison reports show the growing businesses attracting new traffic.

Benchmark results by key departments:

  1. Magazines.  79% of newsagents reported an average decline (in units) of magazine sales of 9.1% – the same YOY decline as last quarter. 86% of reported an average unit-sale decline of Women’s Weeklies of 9.8%. Women’s Weeklies account for around 25% of all magazines sold in a newsagency. Women’s Interests, Food and sport also performed poorly. Home & Living did well. The worst news was for Special Interest – this newsagency exclusive category is showing an average decline of 6.7%. The number of newsagencies reporting declines above 25% is most concerning. 18% of newsagents reported measurable magazine sales growth, some into double digits. While some grew through local circumstance, others grew by engaging with the category.
  2. Newspapers.  91% of newsagents reported an average decline of 5.9% in over the counter newspaper sales.  Again, regional newspapers did not suffer as much.
  3. Greeting cards.  58% of newsagents reported average growth of 3.4%. Some are reporting growth into double-digits. Of those reporting a decline, the average was 4.1% with some much higher.
  4. Stationery.  67% of newsagents reported an average decline of 1.3%. This continues a trend in newsagencies in relation to stationery.
  5. Ink.  37% of stores participating in the study separate ink sales data allowing further analysis.  52% of these stores reported ink sales growth of 4%.
  6. Gifts.  44% of the newsagents in the study have a separate gift department. Of these, 72% reported average year on year growth of 8%.
  7. Plush. 4% of newsagencies report on plush sales in a separate department.  I recommend this.  A reasonable sales benchmark for plush is revenue equal to 25% of card revenue. In stores reporting on plush, sales are up on average 21%.
  8. Tobacco. 77% of stores with tobacco products reported a decline of on average 9.7%.
  9. Confectionery. 62% of stores selling confectionery reported an average decline of 14%.
  10. Toys. 19% of stores with the department reporting growth of just 4%.

Newsagencies continue to be good businesses to own. They respond to attention.  There is good evidence of this in individual store data I have seen. The average newsagency with a retail model 10, 20 and 30 years old is the type of business in trouble. It’s unlikely to be doing anything to insulate against the changes we see impacting traditional lines.

The best type of newsagency to own continues to be the one where you have the most control over what you sell and where you generate traffic for several product categories where average gross profit is 50% or higher.

We create our own luck.

Click here for a PDF of the report.

How should you respond to this study?

Newsagents: look at your business, your sources of traffic, your average GP. Your success will come from many small steps. The most successful newsagencies I see today are run by retailers as retail businesses.

Suppliers: Get smart in your engagement with newsagents. Trust them. Treat them with respect. Share their mission to grow traffic and GP and basket value. Give newsagents complete control over what they sell of your products.

8 likes
Newsagency benchmark

A tough newsagency performance analysis

Here is a newsagency business performance report I did last week. I have been very tough on the owners because I know they can do considerably better. They asked for the assessment because of what they would lose if they sold the business on the current numbers.

The suggestions in this assessment could apply to many newsagencies.

Thanks for the opportunity to look at your business performance data.

Comparing July to September 2013 with 2012 I can see that the business is marking time. On first review, the number of sales is flat and revenue is up 2%. If I take out your ticket sales department I get a different picture.

In my comments I’ll be direct and this may come across as being rude. Please don’t be offended. If I’m rude it’s because the business performance data makes me be that way.

It is important when looking at business performance data that you look at the data that matters. In your case, core product departments of magazines, cards, gifts and stationery matter the most.

It seems to me from the data that you are running an average newsagency for the regional situation you have. While your numbers are not awful they are nothing special. If you want to sell your business then you need to make it appealing, appealing on the shop floor and in your performance numbers. The only way to do this is for you to be above average.

This is a key message I have for you. For you to get what you want, a good sale price for your business, you need to be above average in everything you do.

Here is where I would start based on my assessment of your business.

  1. Lead. You need to lead the business. Set the agenda, decide what the business stands for and live this with every decision. Your business data tells me you are not doing this as performance is barely average.
  2. Stand for something. Your business appears to be boring based on what you’re selling. Nothing is shining. For example, Gifts account for 1% of your sales and tobacco 29.75%. Are you happy with being a tobacco shop? If so they knock yourself out. If not you need to sort out what you stand for and embrace that.
  3. Own your business. This ties into my last point. You;re smart and creative people based on displays I have seen. You understand the importance of engaging with your shoppers through terrific displays. These displays were created to win points or prizes from suppliers. THE MOST IMPORTANT PRIZE YOU WILL WIN IS THE CHEQUE YOU GET FOR SELLING THE BUSINESS. Create displays that chase more value for your business and not a supplier prize. Think abut this very carefully. What works for you? Look at your customers and what they buy and think about what you can promote and how to get them spending more.
  4. Operating costs. Make sure your roster is lean. You also need to make sure that every hour you pay for is efficient and financially valuable for the business.
  5. Cards are 6% of sales yet they are just about the best margin product you have. Your sales are down 4%. What are you doing to arrest that decline. Based on the channel average your card sales should be up. Your data is poor too with 23% of your card sales in unknown category. That’s not acceptable as you can’t manage what you are not measuring!
  6. Magazines are interesting. Overall sales are down but your craft, food and special interest categories are performing very well. Notice what you are dong with those categories? If it is anything special what can you apply to other magazine categories? Your magazine range is a key point of difference for you in your centre and nearby so getting magazines right gives the business a good foundation.
  7. Stationery is odd. It accounts for 3.73% of sales yet it accounts for 27% of data categories you track? Why so anal about tracking stationery when sales are down 9%. Your measuring of stationery performance is not helping you manage the business otherwise sales would be better. What is odd is your apparent pen sales. These should be a third of stationery sales yet they are not. They are a fraction of that. Maybe they are in the 11% of stationery in unknown category, stock you are not tracking.

You can do better than this I am sure of it. I think you need to act urgently on your cost base, your leadership of the business, decluttering and making the business stand for something. You need to create a shop that’s attracting people for more that magazines, cigarettes and western union. You need people seeking your store out for higher margin product that you are KNOWN FOR in the area.

What you need to do is hard. Hard because it’s hard work and hard because you have to reinvent your business within the cash-flow resources of what you are doing today.

One option for you to consider is a make over. Set a budget for new stock, I’d suggest around $5,000. I and some colleagues can order stock based on the knowledge of what is working. We can come in and in a day move the shop around and create a new experience and quit what needs to be quit – all at once and all with some urgency. But you can also do this for yourself.

If you want to sell your business for more…

  1. Sell more higher margin product.
  2. Sell more to every shopper.
  3. Charge more for every item possible without impacting sales.
  4. Cut your costs.
  5. Get customers talking about your business in a good way more.

You can deal with the situation by being a victor or by being a retailer. Choose to be a retailer. I know you can do it.

12 likes
Newsagency benchmark

Newsagency business analysis: turnaround needed

Here’s an analysis I did yesterday for a newsagency in need of reinvention. Before that can be done they need to fix data issues so that they have meaningful data measurement. This is why the analysis is incomplete compared to what I would usually do.

Thanks for giving me the opportunity to look at your sales data for July through September this year compared to last year. The numbers make for sobering reading but I know you understand that from the changes you are already making in the business

Over the thirteen weeks in this period your non agency sales were just below $20,000, or $1,461 a week. Based on the product mix I estimate your current gross profit to be around 28%. This gives you $409 a week out of which to pay wages, rent and operating costs.

A traditional newsagent would try and build off of traditional newsagency lines and while this could work over time, I think the better approach for your business would be to look at the shop as a blank canvass, using this to build a fresh retail offering to serve the needs of your specific area. For example, with the developments going on nearby consider the people purchasing there – if they are families then their interests and needs will be different to if they are retirees.

In your data I can see that magazines currently account for 32.40% of your sales. But at under $500 a week it is very low. Look carefully at the titles selling as this can provide an insight to your customers. While I’d chase magazine growth if I were you, my core focus would be on higher margin lines, lines that can generate their own traffic and for which you can promote your sales.

Newspapers account for 12.84% of your sales. Add newspapers and magazines and you have 45.24% of sales delivering below average gross profit. While newspapers and magazines generate traffic, these products are also available in other retailers near you so they do not offer a major point of difference.

That gifts account for 7.59% of sales is good news. This is an opportunity in your data. Also, considering what is and isn’t nearby, you have an opportunity to be a destination store in the gift / plush / toy space. But developed over time and within a conservative capital expenditure budget.

Today your business would most likely be known as a corner store or a small local old-school newsagency. I think the future for you is to be known for something completely different. A fun shop, somewhere I can find a gift for any occasion. Somewhere I can shop locally for what I might otherwise drive ten of fifteen minutes to find. Convenient gifts, stationery, toys and items likely to sell to these shoppers.

Achieving this requires careful thought on the type of business you want to create. research you can do on this is to look carefully at your card sales – to see what people are buying and why. For example, if kids birthday card sales are strong what can you do to leverage this? Likewise confirmation / christening / baptism cards. While your card sales are low, $207 a week, the data should at least give you an indication for guiding expanding your gift range.

The other department to assess is stationery. What can you see in this? For example, is your stationery business everyday or office related? What’s popular for you? In one newsagency recently a third of their stationery sales were art and craft related products being sold for kids projects. This opened their eyes to opportunities in the kids space that they had not considered as they were looking at stationery sales as adult focused sales. So my question is – what gold can be mined from your stationery sales data. I’d be happy to get someone to help with this if you would like.

The challenge is for you to remove what’s not working and rebuild within budget constraints. I’d do this section by section, from the front of the shop back. Make the front of your business look full and vibrant, reflecting your aspiration to grow into a respected and talked-about local retailer. Nail just one area of the business and then move to the next.

Using your software right is critical. Scan every single thing you sell. If you don’t do this you do not have good data and without good data you cannot make good business decisions.

You can’t turnaround a business in which you are not measuring the performance of what you sell. This business currently is not properly measuring what they sell – to their detriment.

There is no excuse for not measuring, not scanning, everything you sell. You’re in business to get a return on your investment and the only way you will achieve that is if you are efficient and growth focussed. Neither can be achieved without proper measurement.

9 likes
Newsagency