A blog on issues affecting Australia's newsagents, media and small business generally. More ...

Newsagency benchmark

Newsagency sales benchmark results: Jan 1, 2024 – June 30, 2024 vs Jan 1, 2023 – June 30, 2023

I am grateful to the 121 newsagents trading under a variety of shingles in rural, regional and suburban settings who provided data for this study. The only connection is that they use newsagency software from my POS software company. 

Challenging start to 2024 for many newsagents.

The first six months of 2024 have been tough for the many newsagents. It has been especially tough for those who have not transitioned their businesses to rely less on core product categories like papers, magazines and lotteries.

Before I share the averages for the channel, here are results for the top 5 businesses in the benchmark data pool. This small group is made up of regional and suburban businesses. Three of these do not have lotteries, which I think is a factor in the management focus.

  • Revenue: Up by 12%.
  • Sales transaction count: Up 2%.
  • Basket value: Up 10%. This represents a shift in what people are buying.
  • Items per basket: Up 7%.
  • Average item value: Up 4%.
  • Greeting card revenue: Up 7%.
  • Magazines unit sales: Down 13%.
  • Newspaper unit sales: Down 9%.
  • Toy (incl. plush) revenue: Up 12%.
  • Gift revenue: Up 22%.
  • Homewares: Up 15%.
  • Fashion: 70%.
  • Stationery revenue: Up 3%.

Three of these businesses have an online presence with that contributing more than $1,000 a week in revenue.

Here are the averages for business performance measurement points and categories across the whole benchmark data pool:

  • Revenue: Down 3%.
  • Sales transaction count: Down 7%.
  • Basket value: Up 3%. This is an important number.
  • Items per basket: Flat. This is an important number.
  • Average item value: Up 2%. This is an important number.
  • Greeting card revenue: Down 1%
  • Magazines unit sales: Down 11%. This is an unfair measure because of the big difference between businesses, bigger than for any other category.
  • Newspaper unit sales: Down 10%.
  • Toy (incl. plush) revenue: Up 4%.
  • Gift revenue: Up 10%.
  • Stationery revenue: Down 5%. This is also an unfair measure because stationery now includes plenty of gifting items as it has changed.

The group of newsagents most at risk has not changed, it is those with minimal gift, toy and plush products, those not evolving fast enough.

Some traditional suppliers continue to let us down by not actively promoting our channel to attract new shoppers to us. Most newsagents attracting new shopper traffic are doing so on the back of their own local business efforts. Our suppliers need to serve us better.

If you want better results it is up to you to act.

There is no one size fits all solution, anyone who says there is is wrong.

The first step is to understand where you are at, from the data evidence in your business. next, you need a plan. Then, you execute with clarity and commitment, and draw on the support of others who have done this.

I own newsXpress, a marketing group supporting newsagents. newsXpress helps with this. If it interests you, please email help@newsxpress.com.au or call Michael Elvey on 0400 331 055 – he’s not a sales person, he’s part of the team nurturing success.

Mark Fletcher
M | 0418 321 338
https://www.linkedin.com/in/mark-fletcher-tower/

19 likes
Newsagency benchmark

2023 vs. 2022 newsagency sales benchmark results

Thank you to the 117 newsagents trading under a variety of shingles and in a variety of settings (rural, regional and suburban high street) who provided sales data for this benchmark study. The only connection is that they use newsagency software from my POS software company. Their transparency will help many in our channel.

Print media decline has retail newsagents looking elsewhere.

2023 was a tough year for over the counter newspaper and magazine sales. The majority of newsagents, however, did not let that hurt the bottom line, they replaced the revenue declines with growth from better margin categories.

After comparing data from the businesses in the benchmark dataset here are the averages for business performance measurement points and categories, comparing the whole os 2023 with 2022:

  • Revenue: Up 2%.
  • Sales transaction count: Down 8%.
  • Basket value: Up 9%. This is an incredibly important number.
  • Items per basket: Up 5%. This is an incredibly important number.
  • Average item value: Up 4%. This is an incredibly important number.
  • Greeting card revenue: Up 1.5%.
  • Magazines unit sales: Down 10.5%. This is an unfair measure because of the big difference between businesses, bigger than for any other category.
  • Newspaper unit sales: Down 10%.
  • Toy (incl. plush) revenue: Up 5%. 33% of those in the study have this category
  • Gift revenue: Up 18%. The bigger growth in gift revenue came from businesses doing more than $50,000 a year in gifts.
  • Book revenue: Up 24%. 10% of those in the study have this category.
  • Fashion: 65%. 8% of those in the study have this category.
  • Stationery revenue: Up 9%. This is also an unfair measure because stationery now includes plenty of gifting items as it has changed.

The traditional newsagencies with minimal gift, toy and plush products are the ones facing the existential challenge. Some of these newsagents rely on newspaper publishers and other legacy suppliers for advice. That is proving to be a mistake.

If you want better results it is up to you to act.

There is no one size fits all solution, anyone who says there is is wrong.

The first step is to understand where you are at, from the data evidence in your business. next, you need a plan. Then, you execute with clarity and commitment, and draw on the support of others who have done this.

I own newsXpress, a marketing group supporting newsagents. newsXpress helps with this. If it interests you, please email help@newsxpress.com.au or call Michael Elvey on 0400 331 055 – he’s not a sales person, he’s part of the team encouraging success.

Mark Fletcher
M | 0418 321 338
https://www.linkedin.com/in/mark-fletcher-tower/

6 likes
Newsagency benchmark

2023 vs 2022 newsagency sales benchmark study under way

I have started collecting data for a 2023 vs. 2022 newsagency sales benchmark study. While I am doing a whole of year comparison this time around for the whole of channel study, I’ll do a last quarter only study for a smaller group for anyone interested.

My goal for the main study is to get data from at least 120 businesses as this will provide sufficient a dataset to consider the total channel results.

2 likes
Newsagency benchmark

Newsagency sales benchmark results Jan-June 2023 vs. 2022

Thank you to the 107 newsagents trading under a variety of shingles and in a variety of settings (rural, regional and suburban high street) who provided sales data for this benchmark study. The only connection is that they use newsagency software from my POS software company. Their transparency will help many in our channel.

Retail sales grow in the Aussie newsagency channel in the first half of 2023.

Many newsagents who participated in the latest newsagency sales benchmark study have reported a good first half of 2023 compared to 2022.

While growth has slowed that there is growth at all is good news given the stellar results for the channel through the Covid peaks of 2020, 2021 and 2022 when retailers in our channel were essential and open.

The best growth is in non retail newsagency traditional categories such as collectibles, higher end gifts, homewares and self care.

Old-school retail newsagencies focussed primarily on lottery products, papers, magazines and convenience lines made up most of the less successful pool.

After comparing data from the businesses in the benchmark dataset here are the averages for business performance measurement points and categories, comparing 2022 with 2019:

  • Revenue: Up 2.2%.
  • Sales transaction count: Down 9%.
  • Basket value: Up 6%. This is an incredibly important number.
  • Items per basket: Up 4%. This is an incredibly important number.
  • Average item value: Up 3%. This is an incredibly important number.
  • Greeting card revenue: Up 3%.
  • Magazines unit sales: Down 5%. This is an unfair measure because of the big difference between businesses, bigger than for any other category.
  • Newspaper unit sales: Down 7%.
  • Toy (incl. plush) revenue: Up 11%. 30% of those in the study have this category
  • Gift revenue: Up 12%.
  • Plush: Up 16%,. But this is not your every day low price point plush. rather it is plush bought for other purposes, often for an older person.
  • Book revenue: Up 22%. 10% of those in the study have this category.
  • Fashion: 50%. 10% of those in the study have this category.
  • Stationery revenue: Up 6%. This is also an unfair measure because of the big difference between businesses, bigger than for any other category with the best reporting growth of 27%.

There is also interesting data within departments, like stationery and magazines:

  • In magazines, special interest titles are the winners, often delivering double-digit growth.
  • In stationery, everyday is patchy but special interest, fringe, stationery is doing very well. Journals are having a moment, with excellent growth recorded.
  • In cards, lifestyle is terrific in some stores and poor in others. I think suppliers need to do more work here to understand the differences.

For a few stores I have done a deeper dive to look at the last 2 months. This was illuminating because for those stores, which all reported growth in the six months, reported flat results or a decline for May and June. Not a big decline, but a decline nevertheless.

My advice to any retailer right now is to run the business as if conditions are tough, sales are declining, and people are being more careful with their spending. Following that advice will not hurt the business. Indeed, it should achieve the opposite with you buying more carefully, promoting for new traffic more consistently and working to turn the stock you have at a faster rate.

Sightseer retailers will have stories to tell. Not is not a time to be a sightseer. Be ahead of the curve, the wave, the lava from the volcano, whatever image you have – and if it never catches you, you’re ahead, and if it does catch you, you’re ahead. But the sightseer, they’re done.

If you want better results it is up to you to act.

There is no one size fits all solution, anyone who says there is is wrong.

The first step is to understand where you are at, from the data evidence in your business. next, you need a plan. Then, you execute with clarity and commitment, and draw on the support of others who have done this.

I own newsXpress, a marketing group supporting newsagents. newsXpress helps with this. If it interests you, please email help@newsxpress.com.au or call Michael Elvey on 0400 331 055 – he’s not a sales person, he’s part of the team encouraging success.

Mark Fletcher
M | 0418 321 338
https://www.linkedin.com/in/mark-fletcher-tower/

14 likes
Newsagency benchmark

2023 newsagency performance benchmark targets / goals

Benchmarks provide business performance data points against which similar businesses can compare their performance.

Here are the recommended benchmarks for newsagencies:

  • Gross profit: this is the goal gross profit for all product sales not taking into account any revenue or costs related to any agency business. The traditional newsagency average continues to sit at 28% to 32%. In an engaged newsagency, I think a GP% goal of 45% is appropriate.
  • Minimum stock turn. That is, the number of times you sell an item in a year. This is a calculation based on current stock holding against total revenue for a year. Here are suggested stock turn goals by key departments. These numbers are based on what is needed at a minimum for a department to be valuable to you:
    • Cards – 3. The average sits at 1.75. This is too low.
    • Gifts – 7. This means a tight mix of products turning quickly.
    • Toys – 5.
    • Plush – 5.
  • Ratio of Gift revenue to Card revenue: 100% minimum. The goal ought to be 200% or more. If you do $50K a year in cards, toe goal is to do $100K a year in gifts.
  • Revenue per employee – $250 an hour minimum.
  • Revenue PSQM $4,500 – $8,500 depending on country versus city / high street to shopping centre and depending of the product mix. Higher GP lower revenue required.
  • Overall revenue mix percentage targets: Cards: 30%; Gifts/toys/plush: 35%; Stat: 10%; magazines/newspapers: 15%; other: 10%.
  • Category performance notes:
    • Stationery. Pens and writing products should account for more than 30% of revenue.
    • Magazines. Crosswords should account for more than 6% of unit sales.
    • Lifestyle cards. Should be more than 40% of total card sales. growth should be 12% year on year at least.
    • Impulse counter items: (NeeDoh, sensory, putty, world’s smallest) should be more than 10% of toy and related sales.
  • FLOORSPACE ALLOCATION: This is very much a store specific thing. That said: Cards: 20%; new traffic lines: 5%; Gifts/toys/plush: 35%; Stat: 8%; magazines/newspapers: 10%; other products: 10%; office/back room / counter: 10%. You don’t make money from your back room.
  • Mark-up goals: Stationery: 125%; Gifts 110%; plush: 110%, jewellery 300%.
  • Occupancy cost: between 9% and 11% of revenue where revenue is product revenue plus commission from agency lines. Location and situation are a big factor in this benchmark. For example, a large shopping centre business will have a higher cost than a high street situation. NOTE: It is easy to say the landlord is responsible for this ratio. As the retailer you are responsible for margin and revenue.
  • Labour cost: between 9% and 11% of revenue where revenue is product revenue plus commission from agency lines. Labour cost should include fair market costs for all who work in the business. (See above).

Now, these are goals. I share them here for consideration. You should set your own, based on your own situation. The key is to have goals and understand why they are what they are. That’s the reason I have published this information developed by my POS software company Tower Systems and my newsagency marketing group newsXpress – to offer something of a starting point for individual newsagents to consider.

15 likes
Newsagency benchmark

Newsagency sales benchmark study results: 2022 vs. 2019

Thank you to the 119 newsagents trading under a variety of shingles and in a variety of settings (rural, regional and suburban high street) who provided sales data for this benchmark study. The only connection is that they use newsagency software from my POS software company. Their transparency will help many in our channel.

Plenty of good news in retail newsagency benchmark study comparing 2022 to 2019.

Many newsagents had an excellent 2022 compared to 2019, the majority who participated in this benchmark study in fact.

Common among those who did well is active engagement in non newsagency traditional product lines, active promotion of the business outside the business, and focussing on three key metrics: basket value, margin and the cost base of the business.

Common among the businesses that did not report as good results is their focus on traditional newsagency operation: lotteries, papers and magazines more so than other product categories.

What is particularly interesting is the results for businesses that transitioned from traditional in 2019 to innovate in 2022. In those cases, the results are extraordinary. In one million dollar business the revenue was almost the same but business GP% moves from 29% to 34%, which is an extra $50,000 in gross profit. In another business they added $120,000 to their $590,000 revenue with the added revenue for items achieving more than 50% GP.

This is the story that stands out when comparing 2022 to 2019, transition. Transition from relying on agency revenue, from relying on commission, to relying of good margin from sought-after products through which the business can attract new shoppers, non newsagency traditional shoppers. A highlight of the transition as evidenced in the dataset is that size and location do not matter. Okay, location in terms of shopping centre matters as it’s not proving to be a winner for our channel, but outside of shopping centres – city or country, large or small – success is equally attainable.

After comparing data from the businesses in the benchmark dataset here are the averages for business performance measurement points and categories, comparing 2022 with 2019:

  • Revenue: Up 9.5%.
  • Sales transaction count: Down 1%.
  • Basket value: Up 9%.
  • Items per basket: Up 7%.
  • Average item value: Up 7%.
  • Greeting card revenue: Up 7%.
  • Magazines unit sales: Down 1%. This is an unfair measure because of the big difference between businesses, bigger than for any other category.
  • Toy (incl. plush) revenue: Up 22%. 25% of those in the study have this category
  • Gift revenue: Up 35%.
  • Book revenue: Up 15%. 12% of those in the study have this category.
  • Fashion: 70%. 20% of those in the study have this category.
  • Stationery revenue: Up 3%.

Since the above results are averages, there are some considerably below and some considerably above.

There is also interesting data within departments, like stationery and magazines:

  • In magazines, weeklies experienced the biggest decline again. Special interest titles are the winners, often delivering double-digit growth.
  • In stationery, everyday is patchy but special interest, fringe, stationery is doing very well.
  • Newsagents with a unique add-on category, such as firearms, music or pet food, tend to see these doing well.

I have a note about traditional categories: lotteries, papers and magazines. They are important, but they should no longer define your business. Make what you can from them, support them well, but do 9other things to attract new shoppers who will purchase better margin products from you. And on magazines, if you focus on special interest titles and promote them outside your shop, you could do very well.

Evidence.

Common feedback I get from these benchmark studies is can I see the report for the best shop so I can learn. I can’t do that. But I can share snippets. Here are some category specific snippets from different businesses. The results speak for themselves.

Cards.

Gifts.

Toys.

Clothing.

Magazines.

I am concerned about my numbers, what can I do?

If you want better results it is up to you to act.

There is no one size fits all solution, anyone who says there is is wrong.

The first step is to understand where you are at, from the data evidence in your business. next, you need a plan. Then, you execute with clarity and commitment, and draw on the support of others who have done this.

I own newsXpress, a marketing group supporting newsagents. newsXpress helps with this. If it interests you, please email help@newsxpress.com.au or call Michael Elvey on 0400 331 055 – he’s not a sales person, he’s part of the team encouraging success.

Mark Fletcher
M | 0418 321 338
https://www.linkedin.com/in/mark-fletcher-tower/

17 likes
Newsagency benchmark

2022 vs 2019 newsagency benchmark study underway

I have started receiving data for a 2022 vs. 2019 newsagency sales benchmark study which I emailed newsagents about on January 1.

New newsagency benchmark study.

I am collating data for a new benchmark study, comparing 2022 to 2019.

  1. How to participate.
  2. Please run a Monthly Sales Comparison Report for 01/01/2022 – 31/12/2022 compared to 01/01/2019 – 31/12/2019.
  3. Tick the category box. IMPORTANT.
  4. Tick to exclude home delivery and sub agent data.
  5. DO NOT tick the supplier box.
  6. Preview the report on the screen. Save as a PDF.
  7. Email these reports direct to me at mark@towersystems.com.au.Read the report yourself and see what it shows you about your business.

I will email the results to all participating newsagents and publish the results on the Australian Newsagency Blog as a service for all newsagents.

I have chosen to compare to 2019 because that will give us the best indication of where we are at today compared to pre-Covid.

If your 2019 data is blank it is likely because you have archived it. You can unarchive, or compare 2022 to 2021.

It is vital that you look at the report as it will offer insights into things you can do this year to make 2023 better for you and your business.

Thank you for participating. The results will benefit the newsagency channel more widely.

I am excited to see how the channel has fared.

1 likes
Newsagency benchmark

Strong results in Jan – Jul 2022 vs. 2021 newsagency sales benchmark

Thank you to the 109 newsagents trading under a variety of shingles who provided sales data for this benchmark study. Your transparency will help many in our channel.

Strong first half of 2022 for local retail newsagencies.

Newsagents, overall, had a good first half of 2022 when comparing trading figures with 2021. While the increases reported are modest, this is on the back of a better than good 2021 because of Covid.

Of particular interest are strong performances for gifts, magazines, books and toys.

The results show the local newsagency as a business with a strong traffic and revenue core. They also show opportunity considering the growth in some categories for some and not others.

While this latest newsagency sales benchmark study does not include shopping centre businesses as the sample group was too small, I note that they appear to have had a rough first half – begging a question about the status of the shopping centre setting.

After comparing data from the businesses in the benchmark dataset here are the averages for business performance measurement points and categories, comparing January through June 2022 with the same months in 2021:

  • Revenue: Up 2%.
  • Sales count: Down 1%.
  • Basket value: Up 8%.
  • Items per basket: Up 6%.
  • Average item value: Up 7%.
  • Greeting card revenue: Down 2%.
  • Magazines unit sales: Down 4%.
  • Toy revenue: Up 6%.
  • Gift revenue: Up 8%.
  • Book revenue: Up 7%.
  • Stationery revenue: Up 5%.

The percentages are small, especially when you look at 2021 over 2019, however, that earlier comparison was comparing pre-Covid with Covid, which for high street newsagencies was massive.

Since the above results are averages, there are some considerably below and some considerably above.

In terms of type of business, the best performing newsagencies I see in the data are high street suburban followed by high street regional / rural.

It’s what is not in the above benchmark results that is interesting. There are some newsagents experimenting with success. Homewares, whitegoods, hardware and spectacles are all categories delivering growth in reports for a small number of participating businesses. I can see several going from $0 to a reasonable number in on introducing the category.

Some newsagents are quitting categories, too, like ink and toner, toys for some and some agency lines.

There is also interesting data within departments, like stationery and magazines:

  • In stationery, sales are strong for everyday items like pens and paper and less so for less frequently purchased items. Pens, for example, continue to command around 30% of all stationery revenue in newsagencies with strong pen sales. Given their percentage of space allocation and capital requirements, this makes pens a prized segment. I wonder whether there is an opportunity for newsagents to price some stationery with a convenience premium.
  • In magazines, weeklies experienced the biggest decline, an average of 9%, followed by women’s interests while special interest, crosswords and craft & hobbies experienced above average growth to sustain overall magazine performance.

In this benchmark dataset there are 2 newsagencies that introduced gifts, toys and plush to their businesses. In each case the three new categories accounted for more than 6% of total revenue for the six months. One business introduced trading cards part way through the six months and did more than $12,000 in revenue.

The shopper traffic challenge.

A big challenge I see in the benchmark data is shopper traffic.

Our channel was built on being a destination for papers, magazines, cards, lotteries, stationery and, back in the day, tobacco. We’d open the front door and people would come in. Newsagencies were businesses that benefited from the habit based shopper.

Those days are gone, more so in the city than the country, but they are gone.

We need to work harder at attracting shoppers, by stocking a broader range of habit based products and by showing guiding people to purchase, by educating them, enticing them. We do this by being smarter and more engaged retailers, and by doing these things inside and outside of our shops.

Every newsagency, every retail business, needs a new shopper traffic strategy, because if were are not growing the shopper pool, the future of our businesses is at risk.

Stock what could attract new shoppers, display it so passers-by can see it, pitch on social media.

If all we do with something new is put it on the shelf, we fail that new traffic opportunity.

The run home to Christmas

July through December are critical for any retailer. Maximise the opportunity:

  • Go out as early as possible with Christmas.
  • Pursue attracting new shoppers.
  • Stop doing what’s not making you money, which may include adjusting opening hours.
  • Quit dead stock.
  • Follow any green shoots in your business data, every business has these.
  • Be frugal with your roster.
  • Make your shop look the best it has been.

I say all this because even though our channel is producing good results, we have plenty of competitor retailers who are energised to win business, and you don’t want them winning it from you.

The next six months matter because they set you up is you may want to sell next year, they put more money in your pocket and they help you enjoy your business more.

I own and run four newsagencies. Over the years I have had three others. I own newsXpress, a newsagency marketing group focussed on helping newsagents attract new shoppers.

Mark Fletcher
M | 0418 321 338

23 likes
Newsagency benchmark

Collecting data for a 6 month newsagency sales benchmark study

Yesterday I put out a call for data for a jan – June 2022 to 2021 newsagency sales comparison benchmark study and the responses have been flowing in.

I am collating data for a benchmark study This time we are looking at how 2022 is travelling so far compared to last year.

How to participate.

  1. Please run a Monthly Sales Comparison Report for 01/01/2022 – 30/06/2022  compared to 01/01/2021 – 30/06/2021.

  2. Tick the category box. IMPORTANT.

  3. Tick to exclude home delivery and sub agent data.

  4. DO NOT tick the supplier box.

  5. Preview the report on the screen. Save as a PDF.

  6. Email these reports direct to me at mark@towersystems.com.au.

  7. Read the report yourself and see what it shows you about your business.

I decided to check our this year is compared to last, and ignore a comparison to pre-Covid 2019 because I am interested in the more recent changes in what is selling in newsagencies, to see if Covid changes stuck.

2 likes
Newsagency benchmark

2021 vs. 2019 in Aussie newsagencies: new benchmark study launched

I have emailed newsagents yesterday morning calling for data for a 2021 vs. 2019 newsagency sales benchmark study.

I am collating data for a benchmark study, comparing sales covering 2021 vs. 2019.

To best understand 2021, it’s best to compare to 2019, a more stable trading period.

I need your emailed report ASAP please.

How to participate.

  1. Please run a Monthly Sales Comparison Report for 01/01/2021 – 31/12/2021 compared to 01/01/2019 – 31/12/2019.
  2. Tick the category box. IMPORTANT.
  3. Tick to exclude home delivery and sub agent data.
  4. DO NOT tick the supplier box.
  5. Preview the report on the screen. Save as a PDF.
  6. Email these reports direct to me at mark@towersystems.com.au.
  7. Read the report yourself and see what it shows you about your business.

I will email the results to all participating newsagents and publish the results on the Australian Newsagency Blog as a service for all newsagents.

I am keen to see how the numbers stack up. Early indications are terrific.

0 likes
Newsagency benchmark

Strong November retail sales in small business newsagencies

I am grateful to the 56 newsagents who quickly shared their November 2021 vs. November 2019 sales results so I could compare and see how the channel appears to be faring this year. the dataset is a mix of businesses, city and country, in marketing groups and not. All bar two were not in major capital city shopping centres.

I compared 2021 with 2019 so as to check-in with pre-Covid trading and now, with relatively open retail settings.

After comparing data from all 56 businesses here are the averages for business performance measurement points and categories, comparing 2021 with 2019:

  • Revenue: Up 27%.
  • Sales count: Down 6%.
  • Basket value: Up 43%.
  • Items per basket: Up 10%.
  • Average item value: Up 38%.
  • Greeting card revenue: Up 24%.
  • Magazines unit sales: Down 15%.
  • Toy revenue: Up 45%.
  • Gift revenue: Up 30%.
  • Stationery revenue: Up 9%.

There are other categories but I’m not reporting them here as the dataset is small. For example, jewellery. I have data for five businesses and the growth is excellent, but the numbers are too small. Similar niche categories are: jigsaws,  calendars, baby, homewares and garden … all delivering excellent results.

Several businesses reported no revenue growth and several others with extraordinary growth.

It is in the average item value and items per basket where we see the value for a business in that the value compounds. Now, if you can get more shoppers returning, that compounds further.

Of particular interest is the ratio of gift revenue to cards. The goal here now is $3 to $1. Some were at $.5 to $1 and others at $10 to $1. The gap in performance is considerable. Any newsagency business can sustain excellent gift revenue. I have seen this in small towns of around 1,000 people in the area through to capital city businesses. When it comes to gift revenue, population size is not the mot important factor, your range choices and in-store engagement are.

Overall, this benchmark is showing excellent results – good growth not only in revenue but good growth in overall business GP%. This is vital as selling higher GP% items sets the business to be able to sustain a revenue decline without profit decline.

The newsagency channel is healthy. The average newsagency is reporting a revenue surge and a GP surge. Newsagents have every right to be happy. Well done to everyone involved.

I own and run three newsagencies. Over the years I have had three others. I own newsXpress, the newsagency marketing group.

Footnote: I usually do newsagency sales benchmark studies comparing 3 and 6 month periods. 1 month is too small to call a tree on. However, it does provide an insight that can be useful not only in terms of performance but also in terms of transition, and that is evident in the data from this benchmark. More newsagents are evolving outside the lanes traditional to newsagency businesses.

8 likes
Newsagency benchmark

NOVEMBER NEWSAGENCY SALES BENCHMARK STUDY

I am collating data for a quick benchmark study, looking at sales covering November 2021 versus November 2019.

To best understand 2021, it’s best to compare to 2019, a more stable trading period.

I need your emailed report by midnight December 2.

How to participate.

  1. Please run a Monthly Sales Comparison Report for 01/11/2021 – 30/11/2021 compared to 01/11/2019 – 30/11/2019.
  2. Tick the category box. IMPORTANT.
  3. Tick to exclude home delivery and sub agent data.
  4. DO NOT tick the supplier box.
  5. Preview the report on the screen. Save as a PDF.
  6. Email these reports direct to me at mark@towersystems.com.au.
  7. Read the report yourself and see what it shows you about your business.

I will email the results to all participating newsagents and publish the results on the Australian Newsagency Blog as a service for all newsagents.

I own and run three newsagencies. Over the years I have had three others. I own newsXpress, the newsagency marketing group.

0 likes
Newsagency benchmark

New newsagency sales benchmark study launched

I have emailed newsagents this morning to start data collection for benchmark study comparing the first six months of 2021 with 2019. As I explain, I have selected 2019 to compare to because 2020 was an odd (good and bad) year for most.

I have chosen six months because of the opportunity to look at performance over a longer period. Based on early data I have seen from several stores, the results should be interesting, and useful.

First half 2021 NEWSAGENCY SALES BENCHMARK STUDY.
I am collating data for a new benchmark study, looking at sales covering January through June 2021 versus January through June 2019.

Why compare to 2019? Because … 2020 was an odd year. To really understand where your business is at today, we need to compare to two years ago, a more stable trading period.

How to participate.

  1. Please run a Monthly Sales Comparison Report for 01/01/2021 – 30/06/2021 compared to 01/01/2019 – 30/06/2019.
  2. Tick the category box. IMPORTANT.
  3. Tick to exclude home delivery and sub agent data.
  4. DO NOT tick the supplier box.
  5. Preview the report on the screen. Save as a PDF.
  6. Email these reports direct to me at mark@towersystems.com.au.
  7. Read the report yourself and see what it shows you about your business.

I will email the results to all participating newsagents and publish the results on the Australian Newsagency Blog as a service for all newsagents.

I own and run three newsagencies. Over the years I have had three others. I own newsXpress, the newsagency marketing group.

1 likes
Newsagency benchmark

The first newsagency sales benchmark study for 2021 launched

This morning, I kicked off the call for data for the first newsagency sales benchmark study for 2021. I have decided to compare 2021 with 2019, for the reasons I outline below. In samples I have taken already this year, the 2019 comparison provides a more useful analysis for business planning. Here are the details as emailed to newsagents just now:

Q1 2021 NEWSAGENCY SALES BENCHMARK STUDY.
I am collating data for a new benchmark study, looking at sales covering January through March 2021 versus January through March 2019.

Why compare to 2019? Because … 2020 was an odd year. To really understand where your business is at today, we need to compare to two years ago, a more stable trading period.

How to participate.

  1. Please run a Monthly Sales Comparison Report for 01/01/2021 – 31/03/2021 compared to 01/01/2019 – 31/03/2019.
  2. Tick the category box. IMPORTANT.
  3. Tick to exclude home delivery and sub agent data.
  4. DO NOT tick the supplier box.
  5. Preview the report on the screen. Save as a PDF.
  6. Email these reports direct to me at mark@towersystems.com.au.
  7. Read the report yourself and see what it shows you about your business.

I will email the results to all participating newsagents and publish the results on theAustralian Newsagency Blog as a service for all newsagents.

I own and run three newsagencies. Over the years I have had three others. I own newsXpress, the newsagency marketing group.

Here is a video of some of what is offered through the Tower newsagency software:

5 likes
Newsagency benchmark

Newsagency sales benchmark results: Oct – Dec 2020 versus Oct – Dec 2019

Based on sales data covering October through December 2020 and 2019 from 156 newsagency businesses across Australia in city and country locations, high street and mall, the latest newsagency sales benchmark study is revealing as to the impact of Covid on our channel and the value of location.

Revenue surge in Australian newsagency businesses during Covid.

Most too successful to qualify for JobKeeper as sales of some traditional and key new product categories surge.

  • Gifts lead the revenue surge.
  • Toys, games and jigsaws experience double digit growth.
  • Magazine sales grow.
  • Regional newspaper closures do not hurt business performance.
  • Shopping centre newsagencies down, against the trend.

Let’s dive deeper into the results. This round of the benchmark I look at regional and city high street businesses. I have not broken out shopping centre businesses because the dataset is too small. The results from those stores for the quarter, however, are bleak.  Revenue down between 15% and 20%. Steep declines in magazines and newspapers. While some categories, like gifts did okay, performance was nothing like on the high street.

Regional high street businesses.

  • Transaction count change: down 1%.
  • Revenue change: up 11%.
  • Basket size change: up 15%.
  • Newspaper unit sales: down 10%.
  • Magazine unit sales: up 5%.
  • Card revenue: up 7%.
  • Stationery revenue:  up 9%.
  • Gift revenue: up 35%. 75% of businesses report selling gifts.
  • Toy revenue: up 25%. 10% of businesses report selling toys.
  • Puzzle revenue: up 35%. 20% of businesses report selling puzzles.
  • Instant lottery revenue: up 16%.
  • Lottery revenue:  up 4%.

City high street newsagencies.

  • Transaction count change: up 2%.
  • Revenue change: up 7%.
  • Basket size change: up 10%.
  • Newspaper unit sales: down 8%.
  • Magazine unit sales: up 2%.
  • Card revenue: up 7%.
  • Stationery revenue:  up 6%.
  • Gift revenue: up 20%.
  • Toy revenue: up 15%.
  • Puzzle revenue: up 18%.
  • Instant lottery revenue: up 18%.
  • Lottery revenue:  up 3%.

The gift percentages above do not tell the full story. There are some newsagencies that achieved 200% growth off a reasonable base in 2019 of $25,000 in gift sales. Also, there are some newsagencies that booked $200,000+ in gift revenue for the quarter.

Within gifts, homewares are surging with some newsagencies booking more than $25,000 from this segment alone in the quarter. fashion, too, is surging with some recording more than $15,000 in revenue from a segment that the year before contributed $0.

In terms of cards, there are some newsagencies reporting 40% and more growth. This has usually come about through significant shop floor and supplier related adjustments.

Note. 

These are averages. The gap between those doing well and those not doing well is considerable. It is important that newsagents look at their own data as the most important competitor they have is themselves. The trading period from the past against which you compare results is your competitor. Look at those numbers more carefully than you look at these benchmark results.

What have we learned from the last 3 months?

  • There is much good news here.
  • People prefer the high street over shopping malls.
  • There is a feeling that the card shopper community has grown … more people are sending cards.
  • The newsagency channel is healthy.
  • The best growth is coming from categories over which newsagents have the most control – gifts, homewares, toys, games, puzzles, collectibles.
  • Diversification in newsagency product offering is key to success.
  • Having an online presence drives revenue growth.
  • Postable gifts are selling well.

I am grateful to all newsagents who shared their data for inclusion in this study.

Mark Fletcher.
Email: mark@towersystems.com.au  Website: www.towersystems.com.au  Blog: www.newsagencyblog.com.au
M | 0418 321 338

11 likes
Newsagency benchmark

New newsagency sales benchmark study launched

I sent an email to newsagents earlier this morning calling for data for a new newsagency sales benchmark study.

This is an important study as it will provide a glimpse into an important quarter, which is likely to provide an insight into early 2021.

Here is the full text of the call for participation.

Q4 2020 NEWSAGENCY SALES BENCHMARK STUDY.
I am collating data for a new benchmark study, looking at sales October through December 2020 versus 2019.

How to participate.

  1. Please run a Monthly Sales Comparison Report for 01/10/2020 – 31/12/2020 compared to 01/10/2019 – 31/12/2019.
  2. Tick the category box. IMPORTANT.
  3. Tick to exclude home delivery and sub agent data.
  4. DO NOT tick the supplier box.
  5. Preview the report on the screen. Save as a PDF.
  6. Email these reports direct to me at mark@towersystems.com.au.
  7. Read the report yourself and see what it shows you about your business.

I will email the results to all participating newsagents and publish the results on theAustralian Newsagency Blog as a service for all newsagents.

I own and run three newsagencies. Over the years I have had three others. I own newsXpress, the newsagency marketing group.

I am grateful that Tower Systems has added 35 newsagents as customers in the last year as customers of our newsagency software,

As I have done rolling smaller dataset studies monthly for the back half of 2020, I think I have an idea of that this bigger study will reveal. But, who knows?!

Oh, and … happy new year!

3 likes
Newsagency benchmark

Toy-focussed newsagents benefit from extraordinary toy sales growth

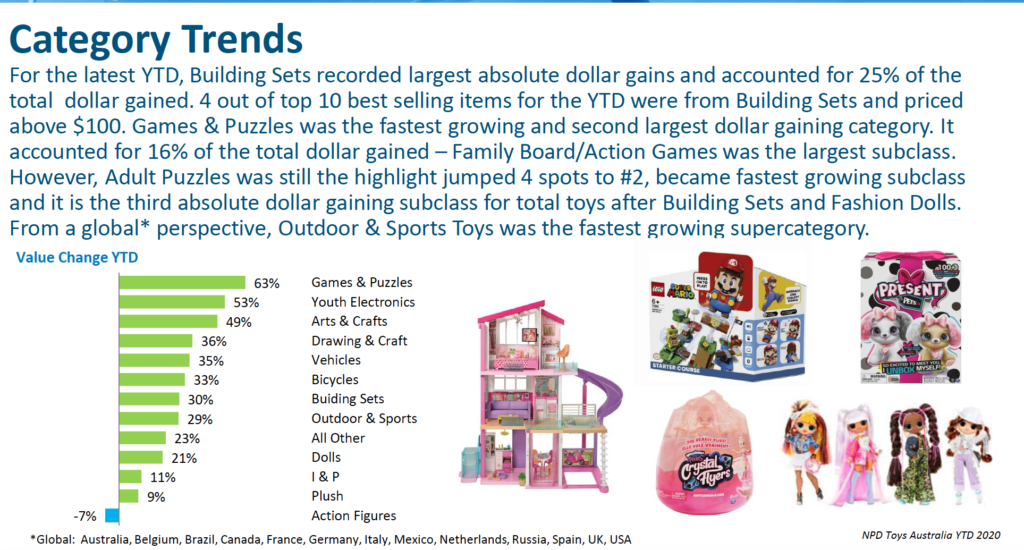
The latest toy sales basket data analysis by the NPD group based on sales data from independent toy retailers, not newsagents, for The Australian Toy Association reveals terrific results in the toy space. Newsagents active in toys with a defined department offer would be doing as well. The headlines from the October sales analysis are excellent

  1. October is the 8th consecutive month of double digit dollar growth.
  2. All major categories posted growth:
    Youth Electronics +86 %
    Arts & Crafts +68%
    Games & Puzzles 48%
  3. Average price grew 3%
  4. 19 of 20 Key Manufacturers grew for month
  5. YTD Games & Puzzles largest growing category
    – With building Sets the largest $$$ gain
  6. Top 5 gaining properties Oct 2019 v Oct 2020
    BLUEY
    NINTENDO
    OUR GENERATION
    LEGO SUPER MARIO BROTHERS
    POKEMON

These are excellent results revealed in this comprehensive report. Here is a snapshot from one page of the NPD report FYI:

Now, bringing the analysis closer to home and looking at data for toys in newsagencies, and specifically newsagencies where toys are 10% or more of revenue, the results are excellent. In October, those businesses meeting this criteria reported year on year revenue growth in toys of 65% or more.

These stores typically have a permeant toy department offer in-store with established brands and regular enhancement of range. Typically, they cover all ages from baby to 80+ because, as the sales this year have shown, everyone can be a toy customer.

Diving even deeper, newsagencies with a webstore more than 3 months old saw 25% of toy revenue come from online.

While it might be reasonable to say these results are Covid related, the reality is that some ope the growth will stick as some shoppers have discovered new retailers and new ways of in home and out of home entertainment.

Suppliers and analysis I speak with in Australia and overseas are predicting a good year for toys in 2021 on the back of what has been achieved in 2020.

Now, to a footnote – there are a couple of categories within toys that some old and tired retailers wrote off as done and over. These categories have lead the growth and delivered extradorinaiy sales. My point is saying this is that customers tell you what’s hot and not more so than tired old retailer eyes.

6 likes
Newsagency benchmark

Newsagency sales benchmark study results: July – October 2020 vs. 2019

Based on comprehensive sales data for July through September 2020 with data from 2019 from 128 newsagency businesses across Australia in city and country locations, high street and mall, the latest newsagency sales benchmark study is revealing as to the impact of Covid on our channel and the value of location.

  • Covid restrictions have benefited many newsagency businesses.
  • High street locations have fared better than shopping mall locations.
  • Regional Australia has performed better that capital city Australia.
  • Diversification of product mix is key to traffic generation.
  • Magazines are back on their pre-Covid trajectory.
  • There are winners and losers.

I have data from a mix of branded and un-branded newsagencies as well as a mix of states and territories in the data set.

Given the extraordinary gap in performance, I share the results for different cohorts, because reporting them as one dataset does not make sense this quarter.

Victorian newsagencies.

Victorian newsagencies have had a good second Covid lockdown. Their newspaper, magazine and lottery products performance is better than other states, because of the lockdown I think.

All but one Victorian high street business I have data for is up on on 2019. The biggest increase relates to average sale value, this has spiked considerably, as you may expect. The categories that have performed best in Victoria this quarter in terms of year on year growth are: cards, gifts, plush, jigsaws, home decor and games.

Even though the data is up to September 30, 2020, it is interesting to see Christmas doing so well in Victorian businesses that had it out. This augurs well for the season.

All Victorian shopping centre businesses are down. Shopping centres are in for a rough few years I think.

Now, outside of Victoria…

Regional high street businesses.

  • Transaction count change: up 3%.
  • Revenue change: up 7%.
  • Basket size change: up 13%.
  • Newspaper unit sales: down 11%.
  • Magazine unit sales: down 9%.
  • Card revenue: up 7%.
  • Stationery revenue:  down 8%.
  • Gift revenue: up 19%. 80% of businesses report selling gifts.
  • Toy revenue: up 11%. 10% of businesses report selling toys.
  • Puzzle revenue: up 43%. 25% of businesses report selling puzzles.
  • Instant lottery revenue: up 26%.
  • Lottery revenue:  up 7%.

City high street newsagencies.

  • Transaction count change: up 1%.
  • Revenue change: up 5%.
  • Basket size change: up 9%.
  • Newspaper unit sales: down 8%.
  • Magazine unit sales: down 9%.
  • Card revenue: up 6%.
  • Stationery revenue:  down 8%.
  • Gift revenue: up 9%.
  • Toy revenue: up 11%.
  • Puzzle revenue: up 60%.
  • Instant lottery revenue: up 28%.
  • Lottery revenue:  up 4%.

Regional shopping centre businesses.

I do not have enough businesses in this group to safely report.

City shopping centre based newsagencies.

  • Transaction count change: down 22%.
  • Revenue change: down 31%.
  • Basket size change: up 2%.
  • Newspaper unit sales: down 13%.
  • Magazine unit sales: down 11%.
  • Card revenue: up 4%.
  • Stationery revenue:  down 17%.
  • Gift revenue: up 11%.
  • Toy revenue: up 9%.
  • Puzzle revenue: up 22%.
  • Instant lottery revenue: up 28%.
  • Lottery revenue:  up 5%.

Note. 

These are averages. The gap between those doing well and those not doing well is considerable. It is important that newsagents look at their own data as the most important competitor they have is themselves. The trading period from the past against which you compare results is your competitor. Look at those numbers more carefully than you look at these benchmark results.

What have we learned from the last 8 months?

  • High street retail fares better than mall based retail.
  • Diversification in newsagency product offering drives better shopper visit efficiency.
  • Having an online presence is vital.
  • People want to connect – this is one reason cards are doing so well.
  • Postable gifts are selling well.
  • Safe buying is key.

I am grateful to all newsagents who shared their data for inclusion in this study.

Mark Fletcher.
Email: mark@towersystems.com.au  Website: www.towersystems.com.au  Blog: www.newsagencyblog.com.au
M | 0418 321 338

13 likes
Newsagency benchmark

Newsagency sales benchmark study launched

Yesterday, I launched a new sales benchmark study to newsagents. This study looks at the Q3 2020 results.

I am collating data for a new benchmark study, looking at sales July through September 2020 versus 2019.

How to participate.

  1. Please run a Monthly Sales Comparison Report for 01/07/2020 – 30/09/2020 compared to 01/07/2019 – 30/09/2019.
  2. Tick the category box. IMPORTANT.
  3. Tick to exclude home delivery and sub agent data.
  4. DO NOT tick the supplier box.
  5. Preview the report on the screen. Save as a PDF.
  6. Email these reports direct to me at mark@towersystems.com.au.
  7. Read the report yourself and see what it shows you about your business.

I will email the results to all participating newsagents and publish the results on theAustralian Newsagency Blog as a service for all newsagents.

I own and run three newsagencies. Over the years I have had three others. I own newsXpress, the newsagency marketing group.

I am grateful that Tower Systems has added 30 newsagents as customers in the last year as customers of our newsagency software,

0 likes
Newsagency benchmark

Newsagency retail sales revenue benchmark results: April – June 2020 vs. 2019.

The positive and negative impacts of COVID-19 on  newsagency retail sales revenue across Australia.

The results of the June 2020 quarter newsagency retail sales benchmark show the extent to which COVID-19 is impacting businesses.

There are winners and losers.

  • The winners are regional and high street retailers.
  • The losers are shipping centre based retailers.

Looking at comprehensive retail sales data from 137 newsagencies for April – June 2020 compared to April – June 2019, the results underscore the value of the retail newsagency channel to local communities. This is a same-store comparison, making the results meaningful. FYI, I removed stores that were closed for any time in the reporting periods.

Data include a mix of rooftops from several brands. The benchmark includes data from businesses using the Tower newsagency software and several who are not.

Given the extraordinary gap in performance, I share the results separately, because reporting them as one dataset does not make sense.

Shopping centre based retail newsagencies.

  • Transaction count change: down 42%.
  • Revenue change: down 36%.
  • Basket size change: up 11%.
  • Newspaper unit sales: down 15%.
  • Magazine unit sales: down 21%.
  • Cards revenue: down 27%.
  • Stationery revenue:  down 11%.
  • Gift revenue: down 45%.
  • Toy revenue: down 42%.
  • Puzzle revenue: up 5%. A quarter of reporting businesses sell puzzles.
  • Instant lottery revenue: up 9%. Half reporting businesses have lotteries.
  • Lottery revenue:  down 5%.

A note about shopping centre data. The dataset in small, just under 10% of respondents. However, the gap between respondents is small.

High street newsagencies.

  • Transaction count change: down 5%.
  • Revenue change: up 27%.
  • Basket size change: up 20%.
  • Newspaper unit sales: down 5%. early din, there was a jump, which has disappeared.
  • Magazine unit sales: up 5%.
  • Cards revenue: up 7%. There are pockets of success – female birthday and thank you cards, in particular.
  • Stationery revenue:  up 13%. Homeschooling and home office, of course.
  • Gift revenue: up 25%. Some categories are down while others, like nesting products, are in triple-digit growth.
  • Toy revenue: up 13%.
  • Puzzle revenue: up 150%. Less than half reporting businesses sell puzzles.
  • Instant lottery revenue: up 16%. Just over half reporting businesses have lotteries.
  • Lottery revenue:  up 4%.

A note about this high street data: it includes regional and rural as well as suburban high street. The performance of regional and rural is considerably better than suburban high street for the most part. How much, you ask? Around 33% better is my response.

Embarrassed.

Plenty of regional and high street newsagents are embarrassed to be reporting such good numbers. Their growth while other businesses nearby are struggling makes them not want to be too open about their success. Even within the newsagency channel there are those in growth who do not want to talk about it with newsagents who are way down.

A moving feast.

Looking at early July data, I’d note that it would be wrong to lock the April – June  results into a view for the long term. We are certainly in a period of significant change. The next quarter results could be different again.

What have we learned from the last 3 and 6 months?

  • Shopping local has been embraced.
  • The high street feels safer than a shopping mall.
  • Newsagencies are trusted and appreciated businesses.
  • Our channel is essential.
  • A newsagency is a good business to own overall.

While we have learned more, this list is my key points.

Finally, I am grateful to all newsagents who shared their data for inclusion in this study.

Mark Fletcher.
Email: mark@towersystems.com.au  Website: www.towersystems.com.au  Blog: www.newsagencyblog.com.au
M | 0418 321 338

9 likes
Newsagency benchmark

Newsagency sales benchmark: April 2020 vs. April 2019, the COVID-19 impact

Winners and losers as COVID-19 impacts newsagency sales across Australia.

While some retail newsagencies report 40% and more growth in revenue in April 2020 compared to April 2019, others report 60% and more decline. Such is the gap in the experience of Australian newsagency businesses in this COVID-19 impacted world.

Looking at comprehensive sales data from 139 newsagencies the results are stunning in that never before in 20 years of benchmark analysis have I seen such a gap in business performance.

The gap in performance has a fresh subtlety too. Whereas in previous studies, geography was the key factor, now, in this COVID-19 world, situation is the key. High street retailers, retailers outside of shopping centres, are faring much better.

In addition to extraordinary overall growth / decline performance, there are surprises in some product categories. Let’s get into it…

THE DATASET
This newsagency sales benchmark study represents a comparison of sales data from 139 newsagency businesses comparing sales from April 2020 with April 2019. It’s a same store year on year comparison from a broad cross-section of businesses: city, country, high street, mall, banner groups, independent. The only thing connecting the businesses is that they use the Tower newsagency software. 

OVERALL PERFORMANCE METRICS.

  • Transaction count. City high street: -4.5%; City mall: -45%; Regional high street: -6%; Regional mall: -35%.
  • Sales revenue. City high street: +6%; City mall: -38%; Regional high street: +12%; Regional mall: -24%.
  • Basket depth. City high street: +11%; City mall: +3%; Regional high street: +13%; Regional mall: +4%.
  • Basket dollar value. City high street: +31%; City mall: +13%; Regional high street: +21%; Regional mall: +17%.

CORE PRODUCTS.

  • Newspapers. Over the counter unit sales. City high street: +6%; City mall: -55%; Regional high street: +11%; Regional mall: -31%. NOTE: the gap in the city high street cohort is considerable, making the average somewhat meaningless. For example, one city high street business reports a decline of 17% while another in the same state reports an increase of 15%.
  • Magazines. City high street: +21%; City mall: -32%; Regional high street: +23%; Regional mall: -7%. NOTE: Within magazines, crosswords, calming titles and escape type titles have done well. Even the dubious content filled weeklies have performed well.
  • Greeting cards. Revenue. City high street: -7%; City mall: -32%; Regional high street: -12%; Regional mall: -31%. NOTE: cards were hit hard early in March because of the tactile nature of browsing cards. There was an indication of improvement in April but it was slow.
  • Stationery. Revenue. City high street: +9%; City mall: -42%; Regional high street: +13%; Regional mall: -16%. A challenge with stationery has been supply.
  • Lotteries – instant scratchies. City high street: +24%; City mall: -5%; Regional high street: +37%; Regional mall: -4%.
  • Lotteries. Revenue. City high street: +3%; City mall: -8%; Regional high street: +5%; Regional mall: -6%.
  • Tobacco. Revenue. City high street: +11%; City mall: N/A; Regional high street: +27%; Regional mall: N/A.

KEY SPECIALTY PRODUCTS.

  • Gifts. Revenue. City high street: +9%; City mall: -31%; Regional high street: +18%; Regional mall: -26%.
  • Toys. Revenue. City high street: +125%; City mall: -38%; Regional high street: +145%; Regional mall: -22%. Less than half the stores in the study have toys.

Toys includes puzzles. In one city high street business jigsaw sales in April went from $870.00 in 2019 to $4,300 in 2020. They were not alone. I mention this to indicate that the average above, 125%, does not do justice to the businesses that positioned themselves well to leverage the jigsaw opportunity.

Gift results are actually all over the place too given that there is a lack of consistency in our channel for what is regarded as a gift.

GP SHIFT.

Exposed in deeper analysis of the sales data is a shift downward in overall GP performance in businesses stock in lotteries, papers and magazines. This result makes for a complex discussion with landlords who may only look at revenue, and not the underlying gross profit performance.

The scratchie surge is considered to be due to people having cash in their pockets from the early boost to Newstart and the closure of poker machine venues.

ONLINE.

Online has proven to be key through all this. Businesses with an established online platform have done well through deliveries=, click and collect and variations of these.

HEALTH OF THE NEWSAGENCY CHANNEL.

I’d say that overall, the channel is okay. Yes, just okay. While there are some stand out successes, there are more at the other end of the scale. The future depends on what happens next and what retailers do next.

There is no doubt that business has fundamentally changes. As local service-oriented retailers, the newsagency business has to change too.  This is why I say what we see next in terms of success or otherwise will depend on smart tactical engagement as well as an ability to successfully predict future trends.

While predicting the future has always been a challenge for business owners, it is even more so now because of how CCOVID-19 has impacted the whole of the economy.

WHAT’S NEXT?

While I have thoughts on that, I’ll same them for another time. I would note, however, that every business that shared data with me has opportunities revealed in their data. I urge people to start there. Look at the trends your data reveal.

Finally, I am grateful to all newsagents who shared their data for inclusion in this study.

Mark Fletcher.
Email: mark@towersystems.com.au  Website: www.towersystems.com.au  Blog: www.newsagencyblog.com.au
M | 0418 321 338

14 likes
Newsagency benchmark

April newsagency sales benchmark to gauge COVID-19 impact

Yesterday morning, I launched a new sales benchmark, comparing April 2020 with April 2019 to gain an insight into the impact of COVID-19 on our channel.

I have already received data from 44 newsagencies, which is terrific – more than is usual for the first 24 hours of a benchmark study. Already, this is a diverse dataset – city and country, mall and high street, banner group and not. This is good as diversity is key for insights.

I am particularly interested in product category trends as this information could be useful to retailers as they start to consider the other side of lockdown.

For any interested, here is the notice of the study:

APRIL NEWSAGENCY SALES BENCHMARK STUDY.
I invite you to provide data for a special COVID-19 related newsagency sales performance benchmark study. The benchmark provides data against which you can compare your business performance. 

How to participate.

  1. Please run a Monthly Sales Comparison Report for 01/04/2020 – 30/04/2020 compared to 01/04/2019 – 30/04/2019.
  2. Tick the category box. IMPORTANT.
  3. Tick to exclude home delivery and sub agent data.
  4. DO NOT tick the supplier box.
  5. Preview the report on the screen. Save as a PDF and email this to me at mark@towersystems.com.au.
  6. Read the report yourself and see what it shows you about your business.

I will email the results to all participating newsagents and publish the results on theAustralian Newsagency Blog as a service for all newsagents.

COVID-19 has impacted our channel in myriad ways. I am aware of significant differences between city and country, mall and high street. I’d love to collate data from a good pool of businesses to provide back to the channel useful data on this.

I own and run three newsagencies. Over the years I have had three others. I own newsXpress, the newsagency marketing group.

Tower Systems serves 1,750+ newsagents with best practice newsagency software, We are thrilled to note that our customer base is growing. We welcomed 30+ newsagency businesses as new customers in the last year. Overall, Tower Systems serves in excess of 3,500 small business retailers.

2 likes
Newsagency benchmark

2019 vs. 2018 newsagency sales benchmark study results

Growth opportunities on show in 2019 vs. 2018 full year newsagency sales benchmark study results.

SUMMARY
Newsagency businesses in the benchmark study data pool focussed on new traffic generators fared well in 2019 compared to the performance of traditional newsagency businesses. 4 of the 5 traditional categories experienced year on year declines while all of the new product categories delivered growth.

Newsagencies focussed on change through new product categories are the future of the channel. New product categories usually offer a significantly better margin, better sell-through rate and better basket efficiency compared to traditional newsagency lines.

New product categories will evolve, too. What is strong today will be challenged by another category tomorrow. Change, substantial change is the new normal in retail.

THE DATASET
This newsagency sales benchmark study represents a comparison of sales data from 161 newsagency businesses for the 2018 and 2019 calendar years. These businesses are representative: city and country, high street and mall, banner groups and independent. The only thing connecting the businesses is that they use the Tower newsagency software. Note: Each data point below is the average, mean, of all data for the data point.

OVERALL PERFORMANCE METRICS.

  • Transaction count. Down 3.5%.
  • Sales revenue. Down 5%.
  • Basket depth. Down 3%.
  • Basket dollar value. Down 3%.

CORE PRODUCTS.

  • Newspapers. Over the counter unit sales. Down 10.5%.
  • Magazines. Over the counter unit sales. Down 12.5%.
  • Greeting cards. Revenue. Down 3.5%.
  • Stationery. Revenue. Down 9%.
  • Lotteries. Revenue. Up 23%.
  • Tobacco. Revenue. Down 19%.
  • Agency. Parcels, gift cards, betting account top-up. Down 4%.

SPECIALTY PRODUCTS.

  • Gifts. Revenue. Up 11%.
  • Toys. Revenue. Up 7%. Includes puzzles.
  • Plush. Revenue. Up 6%.
  • Collectibles. Revenue. Up 5%.
  • Craft. Revenue. Up 3%.
  • Coffee. Revenue. Up 17%.
  • Books. Revenue. Up 6%.
  • Calendars. Revenue. Up 6%.

Despite there being plenty of bad news at the department and category level, this latest study reveals plenty of good news. It encourages confidence around pursuing change, embracing new product categories and leveraging these to help redefine the focus of the business.

While the newsagency shingle remains for many businesses in our channel, movement away from what that shingle has stood for is key to the future.

Print media is a problem.
With 
margins slim – 25% for magazines and around 12% for papers for many – the impact of the continuing decline in sales is significant. The only to make papers and magazines work is to reduce costs associated switch carrying these products – retail space and labour. Changes here can encourage further decline. This is why more newsagents are wondering when they might quit print. 

Unless there is a change to margin percentage and an improvement in magazine cover prices, I suspect more in newsagents will exit print, unfortunately.

The growth categories.
Looking at the product categories for which there was growth – gifts, toys, plush, collectibles, 
craft, coffee – less than half the businesses in the dataset offered more than two of these. Even with the easy category of gift, more than a 25% of those reporting do not offer gifts, which shocks me.

City vs. Country.
Regional and rural businesses continue to perform better. This is across the board. It has always been thus. I think this is due in part to a lower retail space cost, stronger local shopper support and less competition.

Upside opportunities.
Toys, crafts, coffee, gifts, books and plush offer upside, as has been the case for several years. The best success comes from dealing with suppliers who do not usually supply the newsagency channel. That said, what each of these category labels mean varies significantly between businesses.

The role of online.
While there has been growth in the contribution of online, in an average business it accounts for less than 4% of non lottery revenue. There are some achieving more than 10% but they are small in number. Too many newsagents and missing out on the online opportunity.

Is a newsagency a good investment? 
My answer to this question continues to be yes. There is traffic value remaining in core products and opportunity to leverage this in other product categories.

The success of any newsagency business is more reliant on the retailer than on the channel itself. A poor retailer will run a poor newsagency. A good retailer will run a more successful newsagency.

New traffic, better margin, genuine growth in business valuations all come from focussing on products not recently traditionally aligned with our channel.

I own three newsagencies. I am glad I do. I am pleased with their performance.

Finally, I am grateful to all newsagents who shared their data for inclusion in this study.

Mark Fletcher.
Email: mark@towersystems.com.au  Website: www.towersystems.com.au  Blog: www.newsagencyblog.com.au
M | 0418 321 338

29 likes
Newsagency benchmark