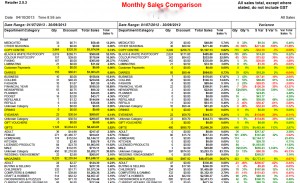
 On the first day of every month I look at the Monthly Sales Comparison Report for my business, comparing year on year performance by department, category and supplier. Looking at revenue as well as unit sales where appropriate. Every good newsagency software package, every good retail business software package, will have a report like the Monthly Sales Comparison Report to enable easy year on year comparison.
Your most important benchmark is how you have done for the most recent period compared to the same period a year ago.
Click on the image to see a larger version. The data in the example is not as important as the layout. I have removed the business name to avoid identification.
On this report you have the most recent period on the left, the older period in the middle and the variances on the right. In seconds you can see how you are doing. This is the report I use most of the time in my businesses. I look at the back page first where I compare traffic, basket value, basket depts and overall sales growth. Next I look at key departments and compare revenue and unit sales performance. For example, with magazines I compare performance at the MPA magazine category level using unit sales as the measure. With stationery, I look at revenue.
I also look at the percentage of revenue by department because balancing the business is important to me. I don’t want too much revenue to come from one department. I manage balancing revenue by growing others rather than shrinking one that is too big.
I urge newsagents to find this Monthly Sales Comparison Report or similar in their software and to use it regularly to track performance. Do this, live by the results reported – and your business will improve.
Footnote: the Monthly Sales Comparison Report is a key report I use when undertaning newsagency business performance analysis. It’s also the report I would look at for any newsagency I was considering purchasing.
We have been running this report each month, it’s great to see increases or no change but depressing to see the decreases.
My magazines are down quite a lot for November which bothers me as I do give this department a lot of my time.
Newspapers are up so I’m guessing we have had less supply issues than we did last November.
Jenny, I have growth in most categories except magazines. I would be interested to read how mags are going for everybody else. July to end of November my mags are down 13%
Allan I think you need to look carefully at categories. For example, our magazine sales are down 12% but once I take out 1D titles we are seeing a 2% decline.
Partworks, crosswords, children’s, home & lifestyle and a couple of others are up.
Thanks Mark, will do.
Alan, Nov down 17% Oct down 10% Sept down 16% Aug up 3% July down 7%
Crap stats when we work hard in this area.
Cards and gifts up, stationary is down but it has been neglected.
Mark, I love this report and look at it at least twice a day, at lunch and end of day as well as month to date.
When looking at the supplier level the second last column $Var% has an incorrect formula. I have asked for this to be fixed previously but no luck to date.
Mark, can you give me some tips to look at with our magazine data. We stopped doing magazine cards a few months ago but that is about the only change that comes to mind. Thanks
Bill I’m not here offering support. I’ll pass it on.
Jenny, email me your report and let me see it.
Compare the years too. 2012 had an extra Thursday.